Beware the index!

Jason Orthman
Hyperion Asset Management
Most broad-based equity indices around the world predominately comprise mature, old-world industrial businesses, highly geared companies including banks, low quality commodity-based businesses, capital intensive businesses and speculative stocks.[1] For many of these companies the long-term return on capital and organic revenue growth outlook is modest at best. This low-quality equity market index problem is particularly obvious in Australia.
Many traditional large-scale businesses that have significant index weights in broad equity market indices around the world face a difficult economic future from a combination of technology-based disruption and a structurally low growth economic environment. Large old-world businesses that traditionally have had substantial scale and brand competitive advantages are finding they are being disrupted by new technologies including internet and digital-based products and platforms. At the same time, these legacy businesses are facing a low growth demand environment where highly geared consumers are realising their middle-income jobs and career paths may not be as secure as they once believed.
Unfortunately, the ability of governments and central banks to stimulate economic activity through fiscal and monetary policies is restricted because of high government debt levels, pre-existing aggressive quantitative easing programs and low official interest rates.
As a result of ongoing technology-based disruption, many traditional large-scale businesses are facing a future where their long-term intrinsic value could approximate zero. The cadence of this structural decline varies by industry with some old-world industries in slow decline and others experiencing rapid declines in value.
At Hyperion, we see ourselves as long-term business owners and thus, sustained growth of the business is key to our investment philosophy. We have never based our portfolio construction on index stock weights. Our investment decisions are based on long-term business fundamentals only. We look for modern businesses, with strong value propositions, that can grow revenues and profits organically at double-digit rates for at least the next decade. To us it makes long-term economic sense to be selective and manage a concentrated portfolio of stocks and not be exposed to a wide number of average to below average pre-internet businesses that comprise most indices and benchmarks. Diversifying into structurally challenged old-world stocks with declining intrinsic values, even if they represent large weights in key indices, is likely to be value destructive in the long term.
Factors influencing Index returns
An equity index is a collection of listed businesses typically weighted by their market value and adjusted for liquidity. Over the long term, the investment returns achieved by the index tend to be primarily a function of the growth in earnings and dividends per share for the largest and most liquid companies in the index. [2] The largest companies within an index have an outsized influence on the earnings growth and income of that index. Most large companies in the key broad-based indices find it difficult to increase their market share because their industry penetration is already high. As a result, they tend to be more reliant on acquisitions, cost reductions and the underlying level of economic activity for growth in their earnings.
If an index is dominated by high quality businesses that can sustain attractive total returns over the long term through a combination of earnings growth and income, then the index may be attractive for investors. However, this has not been our observation in terms of current broad-based index composition.
Total index returns are also influenced by changes in discount rates, which the market uses to value the future income streams of the underlying businesses in the indices. Discount rates are a function of risk perceptions and interest rates. Risk perceptions relate to the uncertainty associated with future free cash flows. Interest rates influence the rate at which future cash flows are discounted back to current dollars. Figure 1 shows how interest rates have varied over the past sixty years, with global index returns benefitting from almost four decades of declining U.S. treasury yields.
Figure 1: 10 Year U.S. Treasury Rate
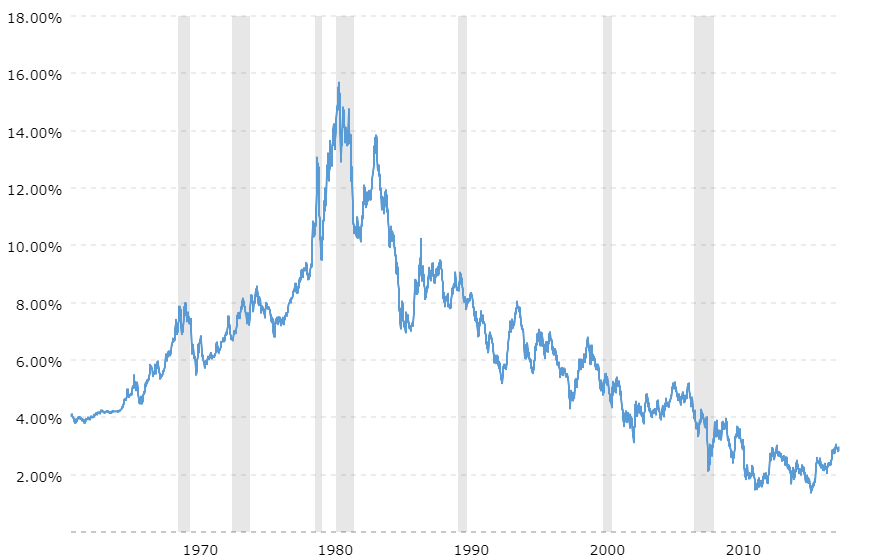
Source: Macrotrends
Figure 1 shows that interest rates climbed dramatically in the decades prior to the 1980s in response to higher inflation and then reversed direction and trended lower. The increase in interest rates and the flow-on effect in terms of higher risk perceptions that occurred in the 1970s resulted in poor equity index returns during that period. The decline in interest rates following the 1980-1982 U.S. recession provided a significant multi-decade tailwind for global stock markets.
The risk perception component of discount rates can be volatile with wide swings based on the market's perception of the outlook for the economy, inflation and future equity returns. Risk perceptions are heavily influenced by behavioural factors including fear, recency biases, linear thinking, short-termism and feedback loops. Risk perceptions tend to result in higher discount rates during times of economic uncertainty. All other things being equal, as long-term government bond yields decline the discount rate used to value stocks tends to also decline and equity valuations tend to increase.
Going forward, we believe that interest rates and inflation are likely to remain low, but the multi-decade tailwind of material declines in interest rates will not be present. Therefore, future equity market index returns will have to rely more heavily on earnings growth and dividends to produce future total real returns.
In recent years, the key global equity indices have performed strongly due to: a cyclical improvement in economic growth; U.S. tax cuts; large infrastructure spending and supply side commodity restrictions by China that have boosted commodity prices; low official interest rates; and continuing high levels of liquidity from the massive quantitative easing undertaken by major central banks post the Global Financial Crisis (GFC). Most of these stimulatory mechanisms cannot continue indefinitely. In fact, the U.S. Federal Reserve has been increasing official interest rates and undertaking quantitative tightening in recent times.
In addition, the world continues to migrate to a winner-takes-all model where average and below average companies continue to suffer from low industry demand growth and a structural decline in the relative strength of their value proposition to customers. However, in a difficult macro economic environment, we believe the return and performance profile of a select group of quality companies will persist. Post the GFC, return on capital and rates of sales growth have declined as large global disruptors with strong value propositions have taken market share from traditional businesses. These new-world disruptor businesses generally still have relatively small index weights or no index weights in key equity indices. This means that the future returns of most indices will suffer more from the failure of the old-world business models than they will benefit from the structural success of disruptive modern businesses.
The shift from mean reversion to a winner-takes-all economic reality is illustrated in Figure 2 below. The profitability of the top decile performers in the MSCI World index has continued to increase while the profitability of the bottom decile performers has continued to decrease. In a structurally lower growth world post 2009, companies have been driven to innovate and invest at a faster rate. The most disruptive companies have accrued significant economic value from this environment. In contrast, there are many traditional average and below average quality businesses that have been sustained by low interest rates, tax reductions, restructuring and mergers. These lower return businesses are unlikely to be able to generate higher returns on capital in the future.
Figure 2: Profitability persistence over time by decile (MSCI World Index)
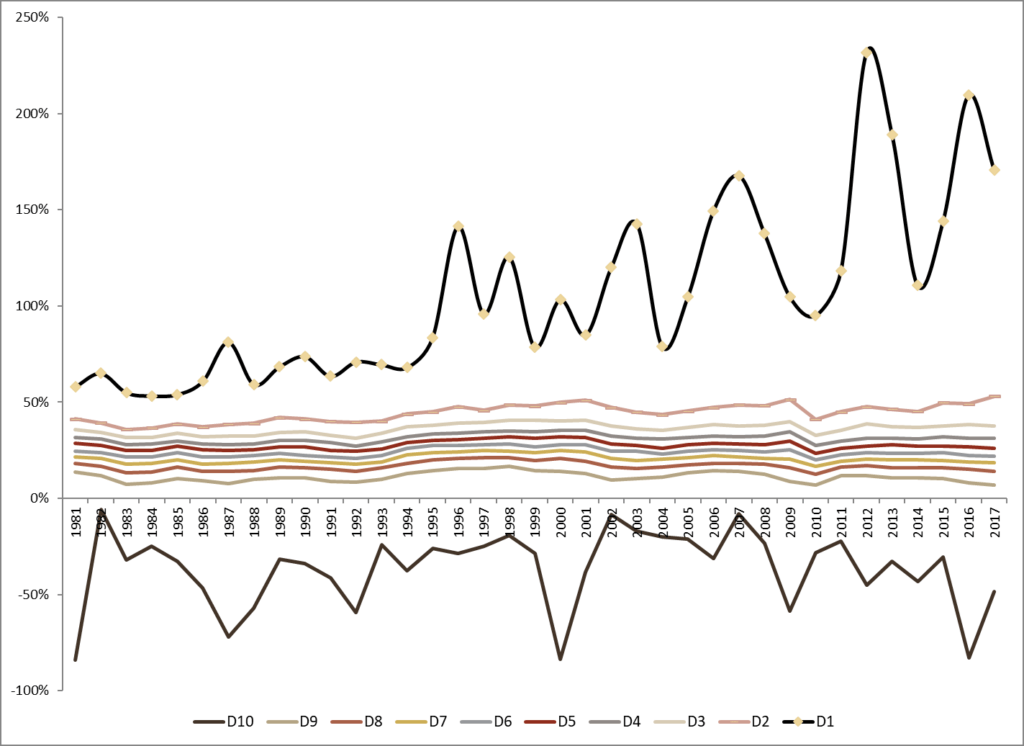
Sources: UBS; Hyperion Asset Management. Note: Operating profitability (OP) equals operating profits (sales minus cost of goods sold minus selling general and administrative expenses minus interest expense) divided by book equity at the last fiscal year end of the prior calendar year.
Manufacturing growth through acquisitions and mergers
In a low growth world, characterised by multiple structural macro headwinds, many businesses will attempt to create the illusion of growth through acquisitions and the associated targeted “financial synergies”. However, the conversion of revenue and cost synergies, as proposed by theoretical merger models into actual reported earnings tends to be illusionary. We are sceptical of management teams willing to “empire build” because in our view the underlying motivation is often the expected receipt of larger remuneration resulting from managing a larger economic entity. In our view, real economic value is created by investing in innovative products or services that solve real world problems, not through undertaking acquisitions. Our observation, based on analysing many acquisitions and mergers over the past two decades, is that most large acquisitions do not achieve their expected synergies. In fact, they tend to destroy value through cultural conflict and distracted management teams.
Finding quality in the Australian stock market can be challenging
The Australian stock market has the advantages of a relatively large economy, a stable democratic political system with a rule of law, independent judiciary, a high standard of living for most of the population, a relatively large middle class and below average levels of corruption. However, we argue the main constituents of the key Australian equity indices are low growth and low quality. The main indices are dominated by materials and energy businesses which are inherently low quality and financials (mainly banks) which are highly geared and heavily reliant for growth on an already highly geared household sector and a structurally challenged old-world business sector. The larger stocks in the index are mature with low forecast earnings growth rates and low levels of technological innovation and research and development.
It was once enough to buy and hold duopolies such as Woolworths (WOW-AU) and Coles (WES-AU) in the domestic market. However, globalisation and growing competition has reduced growth rates and returns on capital. For example, in the grocery market, Woolworths now faces intense competition from both Aldi and Costco (COST-US) with more global operators likely to enter the domestic market over time. The Australian market also lacks meaningful exposure to secular trends such as the shift to e-commerce, cloud computing and electronic payments.
Table 1 below illustrates significant sector weight differences in the S&P/ASX 300 relative to the MSCI World Index. Prima facie, the Australian index appears to be relatively over exposed to highly leveraged and low growth banks, low quality materials businesses and low growth, capital intensive real estate sectors. In addition, the Australian index is extremely underweight to the information technology sector relative to the MSCI. In a nutshell, the Australian index is low quality, low growth and highly leveraged relative to the MSCI World Index.
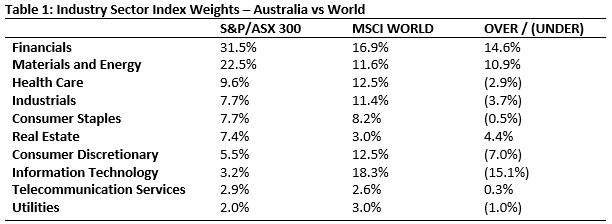
Sources: MSCI; Standard and Poor’s
The top 10 stocks in the S&P/ASX 300 index account for approximately 41% of the index market value, and are predominately old-world businesses, highly-geared banks and commodity-like businesses. Within the top 10 stocks, the 4 major banks represent 21% of the S&P/ASX 300 index by weight, which is just over half of the top 10 stocks by index weight. The business quality of the next 10 stocks, by index weight, is also generally poor. We estimate over 65% of the top 20 (by market cap) is within financials, resources and REITs. Many of these companies look to be in structural decline in the long-term.
Conclusion
The investment returns achieved by key global indices since the early 1980s have been boosted by strong global economic growth rates and a significant reduction in interest rates. The increase in leverage in the decades prior to the GFC across consumers, corporates and governments brought forward consumption and investment and boosted economic growth during this period. Lower interest rates and inflation levels lowered discount rates and allowed price earnings ratios for businesses to expand. This trend to lower discount rates and higher price earnings ratios provided a step change to index returns over the past few decades. Going forward, the returns on most major indices are likely to be much lower than has been the case over the past few decades. The structural headwinds expected to impede future economic growth rates include ageing populations, high debt levels, the disappearing middle class and increasing environmental constraints. These headwinds will impact many of the key companies that comprise the major equity indices.
Hyperion’s investment philosophy is not based on benchmark stock weights but instead is focused on the long-term business economics. We invest exclusively in the highest quality, structural growth businesses available within the relevant investable universe. These businesses are modern, innovative and disruptive with strong and sustainable value propositions to customers and other stakeholders. We avoid mature, low growth, legacy businesses that are likely to be disrupted by new technologies. We believe a low growth world suits Hyperion’s high quality, structural growth investment style and presents a favourable environment for long-term alpha generation.
Written by Mark Arnold (Chief Investment Officer) and Jason Orthman (Deputy Chief Investment Officer)
[1] Key broad-based global indices include the MSCI World Index (23 Developed country markets) or the MSCI ACWI Index (23 developed markets and 24 emerging markets countries).
[2] In addition, changes in discount rates can also have an influence on index returns. However, the influence of changes in discount rates declines as the investment period expands because discount rates are range bound and mean reverting.
Never miss an update
Enjoy this wire? Hit the ‘like’ button to let us know.
Stay up to date with my current content by
following me below and you’ll be notified every time I post a wire
Jason joined Hyperion in 2008 and is Senior Portfolio Manager and Deputy CIO. He is responsible for research of equities across Hyperion’s product range. Prior to joining Hyperion, he worked as a senior research analyst with stock broker, Wilson HTM

2 topics
2 stocks mentioned
Jason Orthman
Deputy Chief Investment Officer & Portfolio Manager
Hyperion Asset Management
Jason joined Hyperion in 2008 and is Senior Portfolio Manager and Deputy CIO. He is responsible for research of equities across Hyperion’s product range. Prior to joining Hyperion, he worked as a senior research analyst with stock broker, Wilson HTM
Expertise
Comments
Comments
Sign In or Join Free to comment