Dalio’s key filters for identifying a bubble

Alex Cowie
If you were to analyse every major debt crisis in the world over the last 100 years, what would you learn? What patterns would emerge? Well Ray Dalio, the founder of the best performing hedge fund in the world has done just that.
“I found that by examining many cases of each type of economic phenomenon (e.g., business cycles, deleveragings) and plotting the averages of each, I could better visualize and examine the cause-effect relationships of each type. That led me to create templates or archetypal models of each type—e.g., the archetypal business cycle, the archetypal big debt cycle, the archetypal deflationary deleveraging, the archetypal inflationary deleveraging, etc. Then, by noting the differences of each case within a type (e.g., each business cycle in relation to the archetypal business cycle), I could see what caused the differences. By stitching these templates together, I gained a simplified yet deep understanding of all these cases. Rather than seeing lots of individual things happening, I saw fewer things happening over and over again, like an experienced doctor who sees each case of a certain type of disease unfolding as “another one of those.”
In commemoration of the 10th anniversary of the GFC, Dalio has released his new book, “A Template For Understanding Big Debt Crises”. In the book, and in classic Dalio fashion, he distils the complex economic machine, into simple principles. He shares these principles with us, and the template he used which helped him do well through the GFC, when almost everyone else did badly.
You can read the 470-page book (which he’s giving for free) or read the wire below for a snapshot of his views. This wire will include highlights from Dalio’s 6 stage template for analysing a deflationary debt cycle, his views on where we are placed in the cycle today, and the key risks investors should be looking out for moving forward.
The 6 stages of deflationary debt cycles
1. The Early Part of the Cycle
“In the early part of the cycle, debt is not growing faster than incomes, even though debt growth is strong. That is because debt growth is being used to finance activities that produce fast income growth. For instance, borrowed money may go toward expanding a business and making it more productive, supporting growth in revenues. Debt burdens are low and balance sheets are healthy, so there is plenty of room for the private sector, government, and banks to lever up. Debt growth, economic growth, and inflation are neither too hot nor too cold. This is what is called the “Goldilocks” period.”
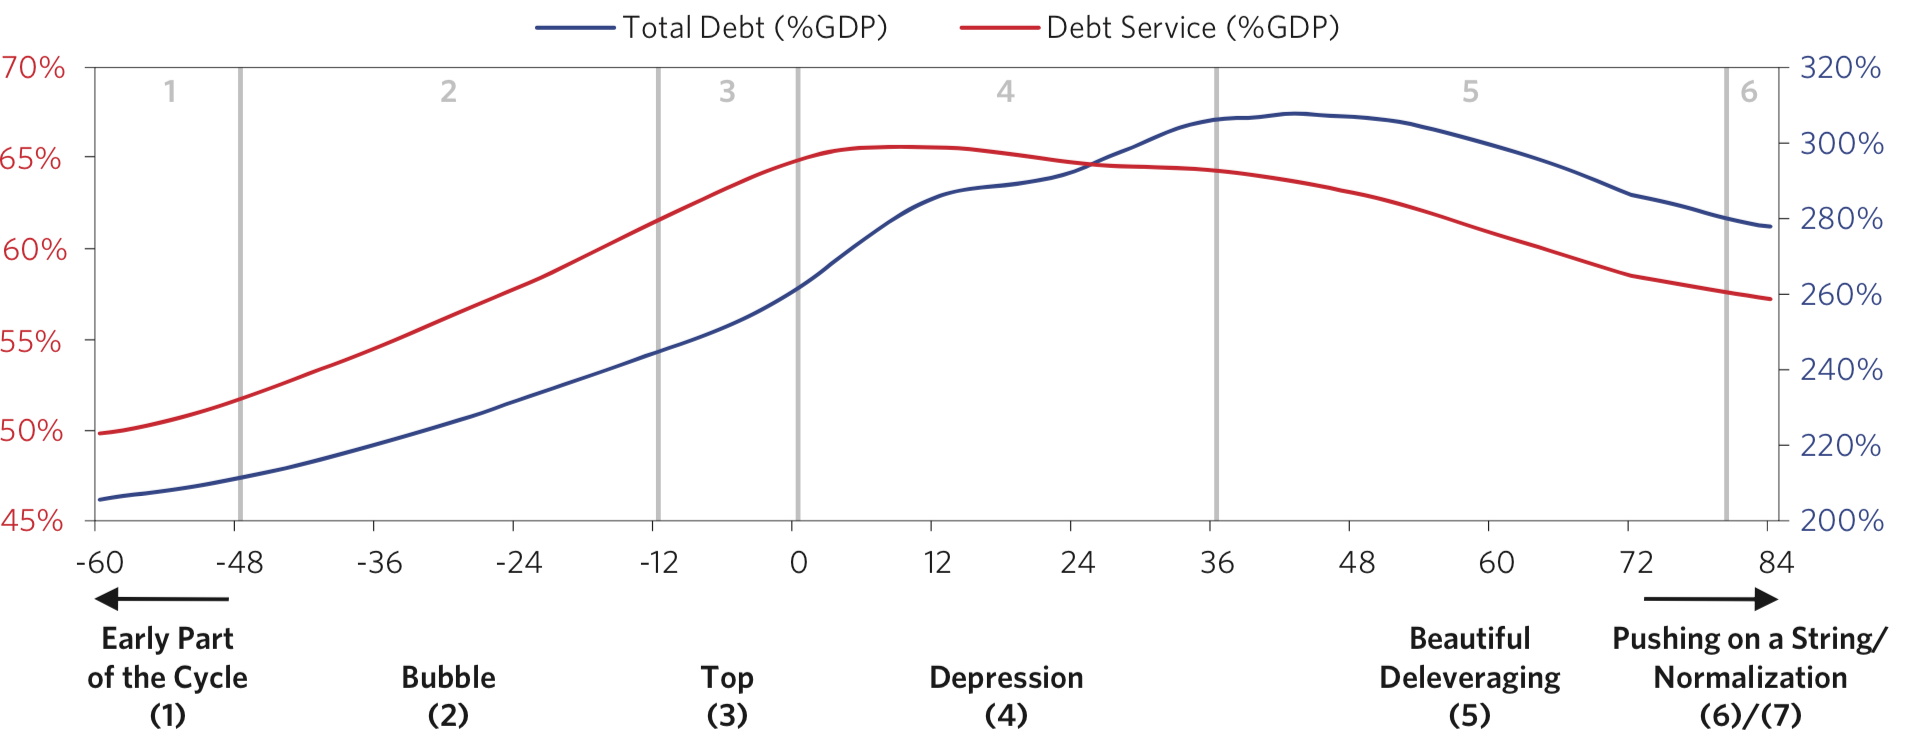
2. The Bubble
“Bubbles usually start as over-extrapolations of justified bull markets. The bull markets are initially justified because lower interest rates make investment assets, such as stocks and real estate, more attractive so they go up, and economic conditions improve, which leads to economic growth and corporate profits, improved balance sheets, and the ability to take on more debt—all of which make the companies worth more.”
“As assets go up in value, net worth’s and spending/income levels rise. Investors, business people, financial intermediaries, and policymakers increase their confidence in ongoing prosperity, which supports the leveraging-up process. The boom also encourages new buyers who don’t want to miss out on the action to enter the market, fuelling the emergence of a bubble.”
His key indicators for what the archetypal bubble looks like…
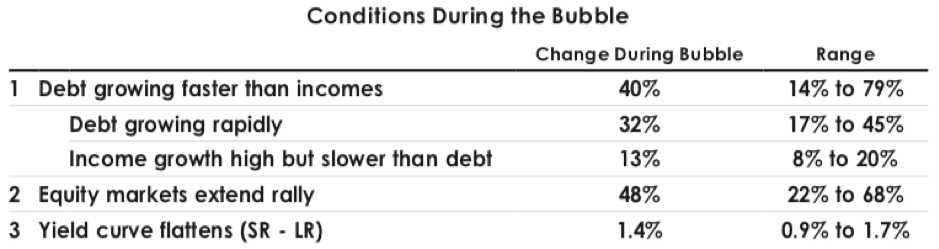
“Taking stocks as an example, rising stock prices lead to more spending and investment, which raises earnings, which raises stock prices, which lowers credit spreads and encourages increased lending (based on the increased value of collateral and higher earnings), which affects spending and investment rates, etc. During such times, most people think the assets are a fabulous treasure to own—and consider anyone who doesn’t own them to be missing out. As a result of this dynamic, all sorts of entities build up long positions. Large asset-liability mismatches increase in the forms of a) borrowing short-term to lend long-term, b) taking on liquid liabilities to invest in illiquid assets, and c) investing in riskier debt or other risky assets with money borrowed from others, and/or d) borrowing in one currency and lending in another, all to pick up a perceived spread. All the while, debts rise fast, and debt service costs rise even faster.”
His key filters for identifying a bubble…
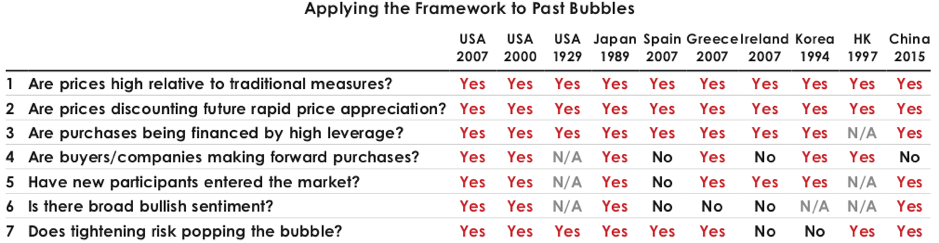
3. The Top
“When things are so good that they can’t get better—yet everyone believes that they will get better—tops of markets are being made.”
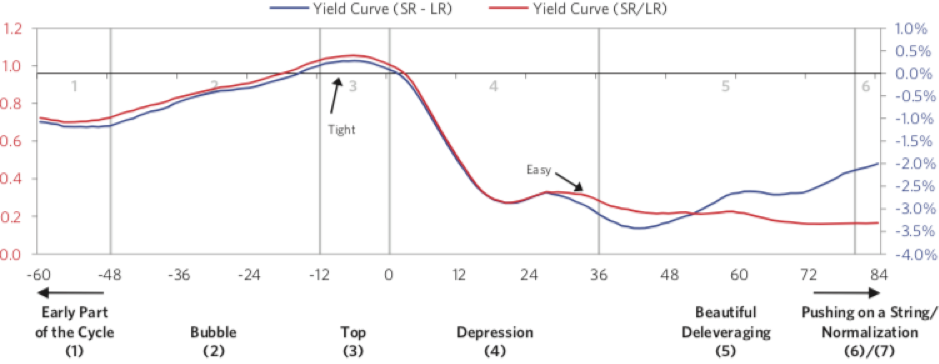
“In the early stages of a bubble bursting, when stock prices fall, and earnings have not yet declined, people mistakenly judge the decline to be a buying opportunity and find stocks cheap in relation to both past earnings and expected earnings, failing to account for the amount of decline in earnings that is likely to result from what’s to come.”
“The fastest rate of tightening typically comes about five months prior to the top of the stock market.”
“The more leverage that exists and the higher the prices, the less tightening it takes to prick the bubble and the bigger the bust that follows."
4. The Depression
“Lack of cash flow is an immediate and severe problem—and as a result, the trigger and main issue of most debt crises.”
“First, contrary to popular belief, the deleveraging dynamic is not primarily psychological. It is mostly driven by the supply and demand of, and the relationships between, credit, money, and goods and services—though psychology of course also does have an effect, especially in regard to the various players’ liquidity positions.”
“If everyone went to sleep and woke up with no memory of what had happened, we would be in the same position, because debtors’ obligations to deliver money would be too large relative to the money they are taking in. The government would still be faced with the same choices that would have the same consequences, and so on.”
“Because one person’s debts are another’s assets, the effect of aggressively cutting the value of those assets can be to greatly reduce the demand for goods, services, and investment assets. For a write-down to be effective, it must be large enough to allow the debtor to service the restructured loan. If the write-down is 30 percent, then the creditor’s assets are reduced by that much. If that sounds like a lot, it’s actually much more. Since most lenders are leveraged (e.g., they borrow to buy assets), the impact of a 30 percent write-down on their net worth can be much greater. For example, the creditor who is leveraged 2:1 would experience a 60 percent decline in his net worth (i.e., their assets are twice their net worth, so the decline in asset value has twice the impact). Since banks are typically leveraged about 12:1 or 15:1, that picture is obviously devastating for them and for the economy as a whole.”
5. The Beautiful Deleveraging
“More specifically, deleveraging’s become beautiful when there is enough stimulation (i.e., through “printing of money”/debt monetization and currency devaluation) to offset the deflationary deleveraging forces (austerity/defaults) and bring the nominal growth rate above the nominal interest rate—but not so much stimulation that inflation is accelerated, the currency is devalued, and a new debt bubble arises.”
“All of the deleveraging’s that we have studied (which is most of those that occurred over the past hundred years) eventually led to big waves of money creation, fiscal deficits, and currency devaluations.”
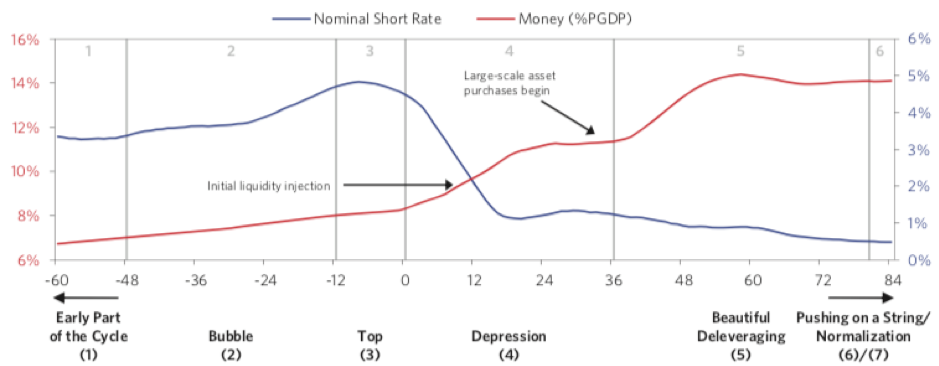
“The chart below conveys the archetypal path of money printing in deflationary deleveraging’s over the 21 cases. The money printing occurs in two classic waves—central banks first provide liquidity to stressed institutions, and then they conduct large-scale asset purchases to broadly stimulate the economy.”
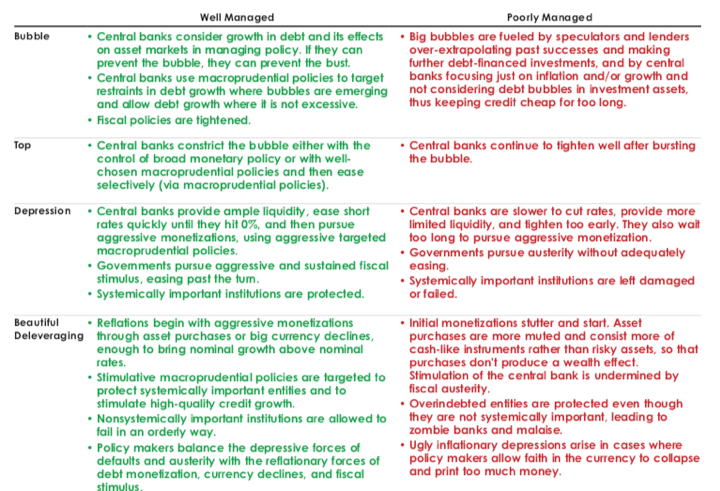
On the key things distinguishing whether or not a deleveraging is managed well or poorly…
6. Pushing on a String / Normalisation
“Late in the long-term debt cycle, central bankers sometimes struggle to convert their stimulative policies into increased spending because the effects of lowering interest rates and central banks’ purchases of debt assets have diminished. At such times the economy enters a period of low growth and low returns on assets, and central bankers have to move to other forms of monetary stimulation in which money and credit go more directly to support spenders.”
“Over time, the use of QE to stimulate the economy declines in effectiveness because risk premiums are pushed down, and asset prices are pushed up to levels beyond which they are difficult to push further, and the wealth effect diminishes. In other words, at higher prices and lower expected returns, the compensation for taking risk becomes too small to get investors to bid prices up, which would drive prospective returns down further. In fact, the reward-to-risk ratio could make those who are long a lot of assets view that terribly returning asset called cash as more appealing.”
“Low-interest rates together with low premiums on risky assets pose a structural challenge for monetary policy. With Monetary Policy 1 (interest rates) and Monetary Policy 2 (QE) at their limits, the central bank has very little ability to provide stimulus through these two channels—i.e., monetary policy has little “gas in the tank.” This typically happens in the later years of the long-term debt cycle (e.g., 1937-38 and now in the US), which can lead to “pushing on a string.” When this happens, policymakers need to look beyond QE to the new forms of monetary and fiscal policy characterized by Monetary Policy 3.”
“It typically takes roughly 5 to 10 years (hence the term “lost decade”) for real economic activity to reach its former peak level. And it typically takes longer, around a decade, for stock prices to reach former highs because it takes a very long time for investors to become comfortable taking the risk of holding equities again (i.e., equity risk premiums are high).”
What part of the cycle are we in today?
On where we are vs. the GFC…
“Debt has increased but debt service payments relative to incomes have not risen like they've had in 2007 – 2008”
“But if you look at the corporate cash and you look at the maturity of the debt, when we run the pro forma financial calculations, it's nothing like 2007 looked like to 2008. There's a squeeze that'll be emerging, but generally speaking, we're in I would say the seventh inning of this cycle. I think that we're at the stage in the cycle where interest rates are being raised. We're in the later stage probably, maybe we have two more years I would say into the cycle.”
On the period most closely analogous to today…
“Then the issues of this debt crisis are very different than the last crisis. Each one's a little bit unique. This one looks very much more like the 1935-1940 period.”
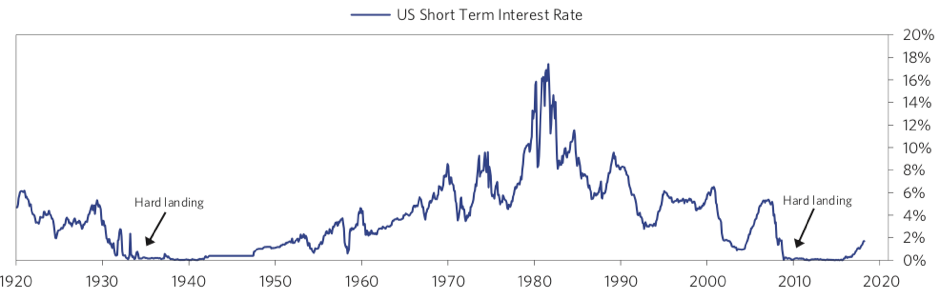
“Because I think the parallels are really important to understand. Okay, 1929-1932 and 2008-2009, we have a debt crisis and interest rates hit zero. Both of those cases, interest rates hit zero. Only two times this century. There's only one thing to do next and that is to print money and buy financial assets. In both of those cases, that's what the central bank did and they pushed asset prices up.
As a result, we had an expansion and we had the markets rising. We particularly had an increase in the wealth gap, because if you'd owned financial assets, you got richer. If you didn't, you didn't. And so what today we have is a wealth gap that's the largest since that period. The top 1/10th of 1% of the population's net worth is equal to the bottom 90% combined. You have to go back to 1935-1940.
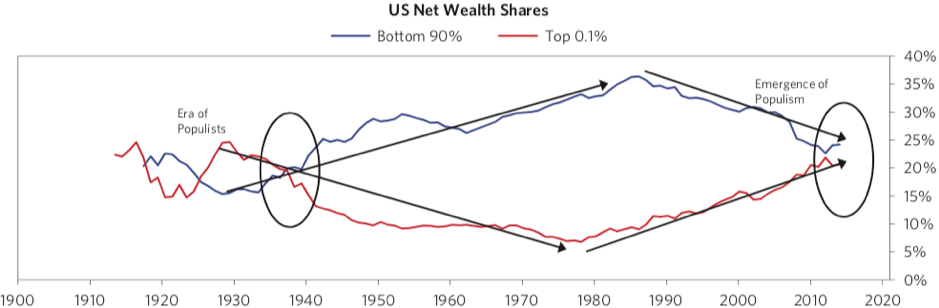
As a result, we have populism. Populism is the disenchanted, capitalism not working for the majority of people. So, we have that particular gap. We have a political gap, a social gap in terms of the economics, and we're coming into the phase where we're beginning the tightening cycle.
1937, we begin a tightening cycle. We begin a tightening cycle at this point. No tightening cycle ever works out perfectly, that's why we have recessions. We can't get it perfectly, so as we're going into this particular cycle, we have to start to think, well, what will the next downturn be like?
We're nine years into this. As you have a downturn, I believe that there's political and social implications to that related to populism and less effective monetary policy. There's less effective monetary policy because so far there are two types of monetary policy used.
Lowering interest rates, we can't lower interest rates. The second is quantitative easing and it's maximised its effect. So, I think that the next downturn is going be a different type of downturn.”
What are the key risks investors should be looking out for moving forward?
“It won't be the same in terms of the big bang debt crisis. It'll be a slower growing, more constricting sort of debt crisis that I think will have bigger social implications and a bigger international implication.”
Can't rates be raised and balance sheets unwound as fast as possible?
“No, no, no. Because if you raise rates now, all the rate structure's affected and carries through all markets. Because it's a discount rate for the present value of all asset classes. I think you have to start to think of what monetary policy three is, particularly in Japan, you're going to need it. But the type of thing where it's not just the purchase of financial assets, it gets individuals to make their purchases of actual assets.”
What areas are most prone?
“I think that there should be a national initiative to look at the parts of the population that are not benefiting from the cycle. I think that education in many ways is just terrible. I think the most important thing is the ways to create opportunity and productivity in that group.”
“Imagine it. If you have a downturn, what will it be like? It's a basic principle that if you have a big difference in wealth and you share a pie, you divide the budget in one way or another and you have an economic downturn, that people are at each other's throat.”
On the consequences….
“What I was referring to is that the conflicts that we have internally between the left and the right and those who have and those who have not (referring to the wealth gap). We also get elected populace (referring to populist movements) and then we also have international tensions.
When we had the Smoot-Hawley tariff and we had Japan rising as a power, Germany rising as a power, in much same way as China's rising as a power. We had a situation where there were economic rivalries out in Asia
So 1931 was when the Japanese invaded Manchuria and that they started to compete with resources. That took 10 years, but 1941 was the bombing of Pearl Harbour. I'm saying that you're in a situation where also we have rising powers, China's a rising power, competing with the United States.
Those tensions get carried forward there and those are economic tensions of paramount importance. But those economic tensions produce conflicts in various ways. Everybody should be cautious about that.”
What did that mean for the stock market back then (1936-1939)?
“Not too good. Fell over 50%”
So what does that mean for stock markets today?
“I don't think it's as anything like that. Right now, we have just gotten to the point in my judgement that the risk return is more negative.”
Earlier this year at Davos, he was bullish, what’s his view now?
“There was a lot of cash on the sidelines. A lot more of that cash has been deployed. We had the benefit of the corporate tax cuts behind us. If we look at what's being discounted, what's being discounted is about right. In other words, if you look at the projected returns of equities relative to cash and bonds, the projected returns look sort of about right”
Right now, whatever is more defensive, I would then be in a more defensive posture. Whatever your strategic allocation issue is, you know what your strategic mix is, I would be less aggressive rather than more aggressive.”
“I have concerns over a two-year timeframe. if I was to take now and think over the next two years, that's where my concerns are."
“I think more than likely, we'll be in these general vicinities for a while.”
Sources:
A Template For Understanding Big Debt Crises
Ray Dalio's Lessons From The Financial Crisis | CNBC
A special thanks to Eric Nguyen for his work in producing this summary.
Never miss an update
Enjoy this wire? Hit the ‘like’ button to let us know.
Stay up to date with my current content by
following me below and you’ll be notified every time I post a wire
By
Alex Cowie,
Alex happily served as Livewire's Content Director for the last four years, using a decade of industry experience to deliver the most valuable, and readable, market insights to all Australian investors.

4 topics
Alex Cowie
Content Director
Alex happily served as Livewire's Content Director for the last four years, using a decade of industry experience to deliver the most valuable, and readable, market insights to all Australian investors.
Expertise
Alex Cowie
Content Director
Alex happily served as Livewire's Content Director for the last four years, using a decade of industry experience to deliver the most valuable, and readable, market insights to all Australian investors.
Expertise
Comments
Comments
Sign In or Join Free to comment