Livewire Summer School: November rain, and insurance claims
Guns N’ Roses released their first debut album titled “Appetite for Destruction” in July 1987. Three months later one of the most violent and unexpected equity market corrections in US history occurred. The Dow lost 22.6% of its value on Black Monday, and the causes behind the dramatic fall are still debated. Thirty years later, a loose consensus has formed that the primary causes of the crash were a combination of; high equity market valuations, market illiquidity, a distortion in the market created by program trading (and in particular the widespread use of portfolio insurance), and information asymmetry which fed fear through the markets. One thing was clear, it wasn’t a significant shift in the economic data or a shift in interest rate expectations that prompted the collapse – the crash was a market event, not an economic event.
The song ‘November Rain’ was not on the Appetite for Destruction album. The earliest version of the song was performed during the 1983 recession, it was considered still a work in progress at the time of 1987 Black Monday crash and was finally released on the “Use Your Illusion” album coinciding with the 1991 recession. The long gestation period for the song spanned 3 of the most significant economic events in the post-War period. According to the band, the theme of the song is avoiding being in a position of having to deal with unrequited love. It is a suitable metaphor for portfolio managers. Sometimes you fall in love with a market, sometimes the market doesn’t love you back. The trick is knowing when to walk away.
So what are the most loved market themes at present? We would nominate the top four as;
1. Being long global equity markets
2. Being long corporate credit
3. Positioning for a flatter yield curve
4. Being long commercial property
All four have their own dynamics and fundamentals but all four are the asset class expression of the view that volatility will remain subdued and expectations of robust growth and low inflation will continue into the distant future. We have been advocates for the strong acceleration in global growth, however, where we differ from the current market consensus is that volatility is unlikely to stay suppressed forever. A shift in views on future inflation and a miscalculation by markets on the implications Quantitative Tightening (QT) present as the most likely events to prompt a rise in volatility. We have written on these in recent months and we won’t repeat the analysis in this note.
The purpose of this note is not to opine on what the potential causes for a rise in volatility may be, rather we calculate that volatility within and across asset classes are at historic long-term lows and to stress the significant dangers that the surge in volatility targeting investment strategies currently pose to financial markets. Indeed, at a time of elevated valuations for traditional asset classes, clear parallels can be drawn to the series of events that led to the 1987 crash and current market developments. A near-term spike in volatility and a large drawdown in financial asset prices is not a fait-accompli, however, we believe it’s time to take out insurance against that event.
The ‘greatest’ of the ‘great moderations’
“’Cause nothin’ lasts forever…”
As a first step it is important to acknowledge just how compressed volatility is, both within and across asset classes. Exhibit 1 shows the familiar VIX index and our measure of global cross asset class volatility (measured as the average of the rolling 30 day standard deviation of major equity markets, major bond markets and global corporate credit markets).
Exhibit 1: Global markets are in a near record low volatility environment
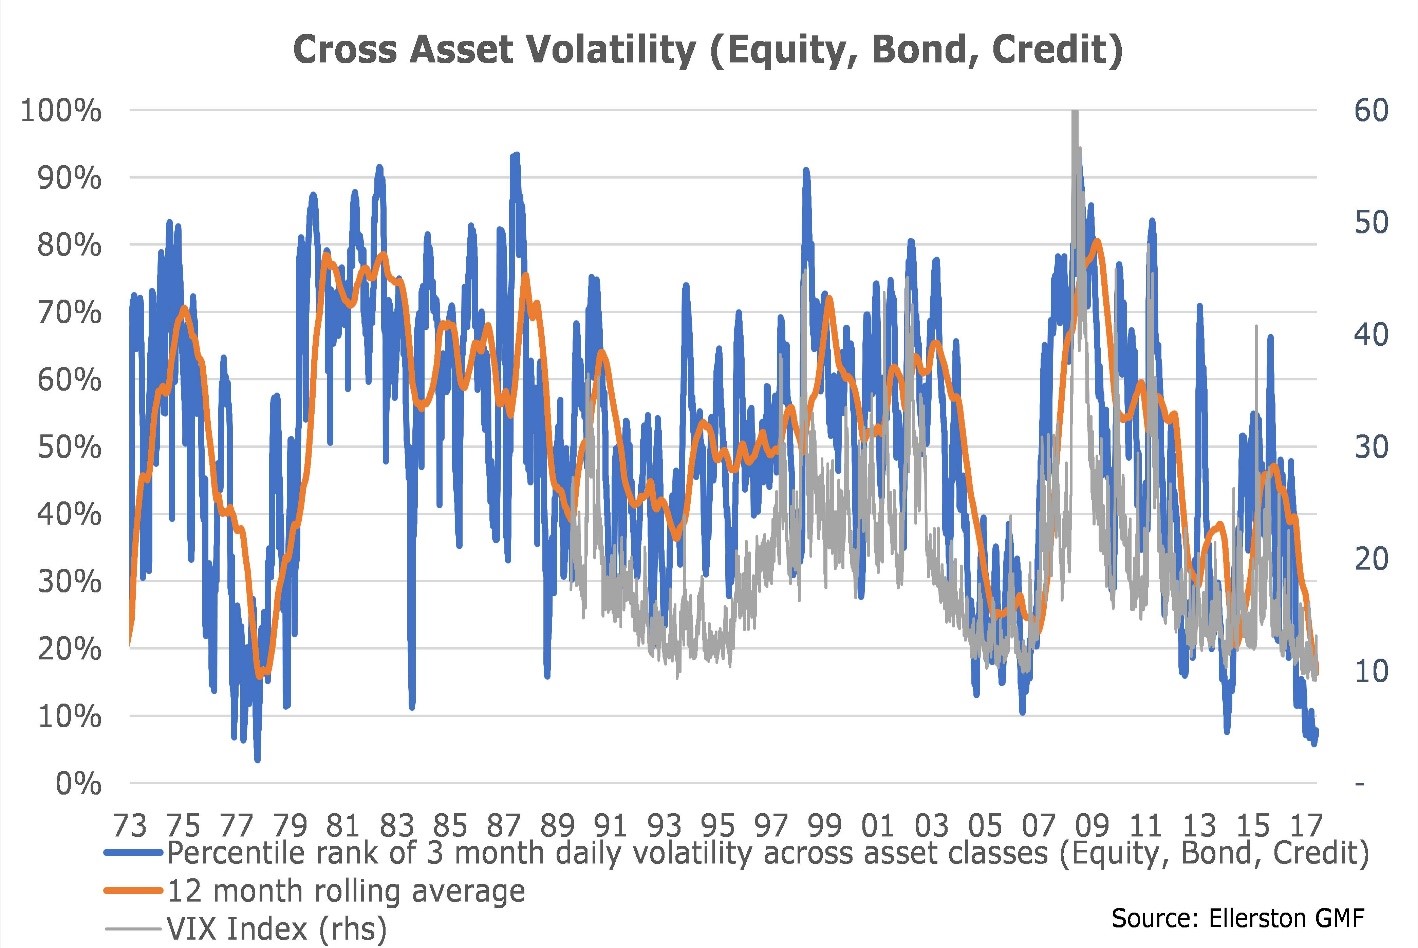
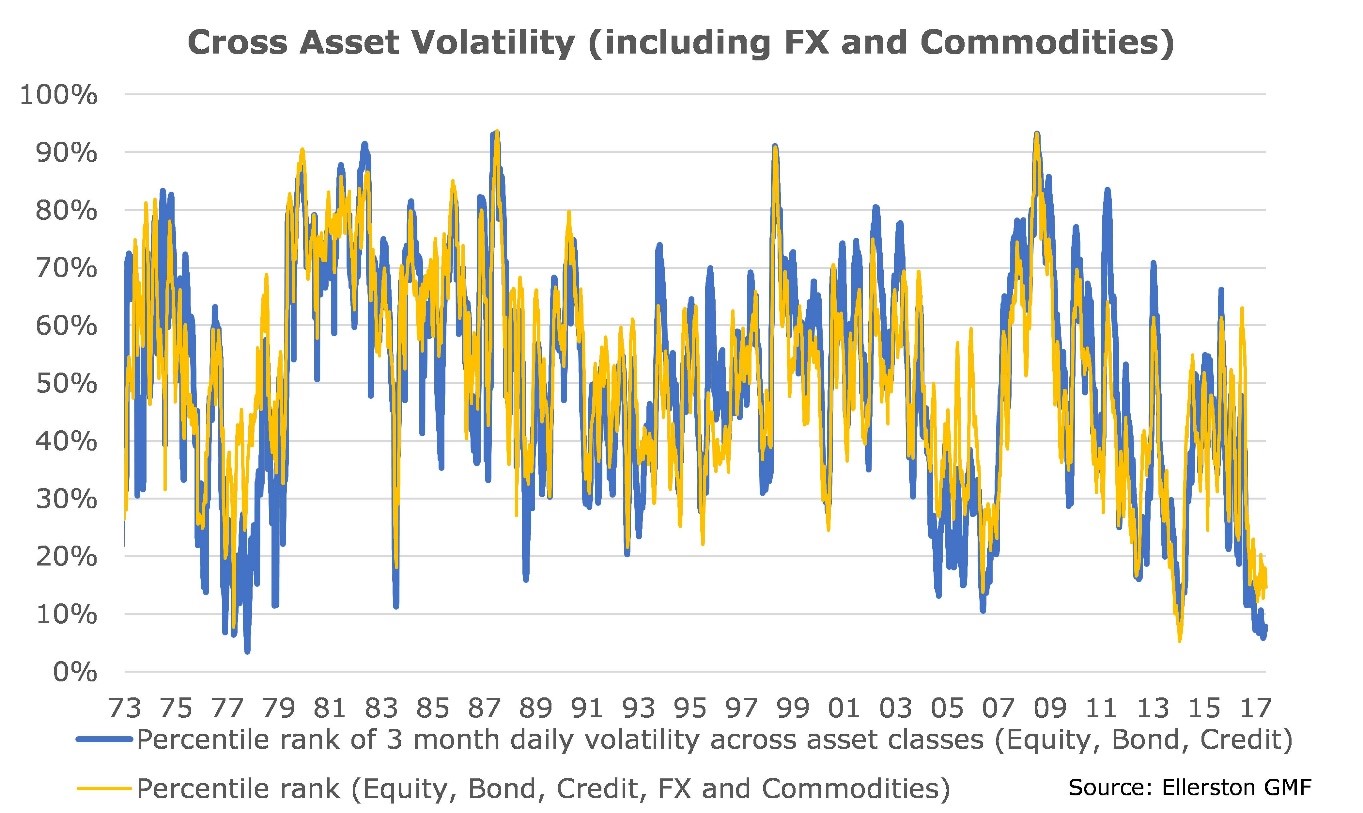
If you thought that the VIX index was low, then realised cross asset class volatility is not only materially lower than what the VIX suggests, it is near the lowest as far back as comparable data exists. Since the early 1970’s, 99.8% of the time, cross asset volatility has been higher than today – the only time volatility was temporarily lower was during early 1978. For those that believe FX and commodities deserve equal attention as equities, bonds and corporate credit, Exhibit 2 shows that the conclusion is little altered – realised volatility is as low as any other period in modern history.
Exhibit 2: Including FX and commodities does not alter the conclusion
Moreover, Exhibit 3 illustrates that volatility in the asset classes of equity, bonds and credit are not only near record lows the dispersion between the asset classes is unusually low.
Exhibit 3: Historically low volatility between equities, bonds and credit
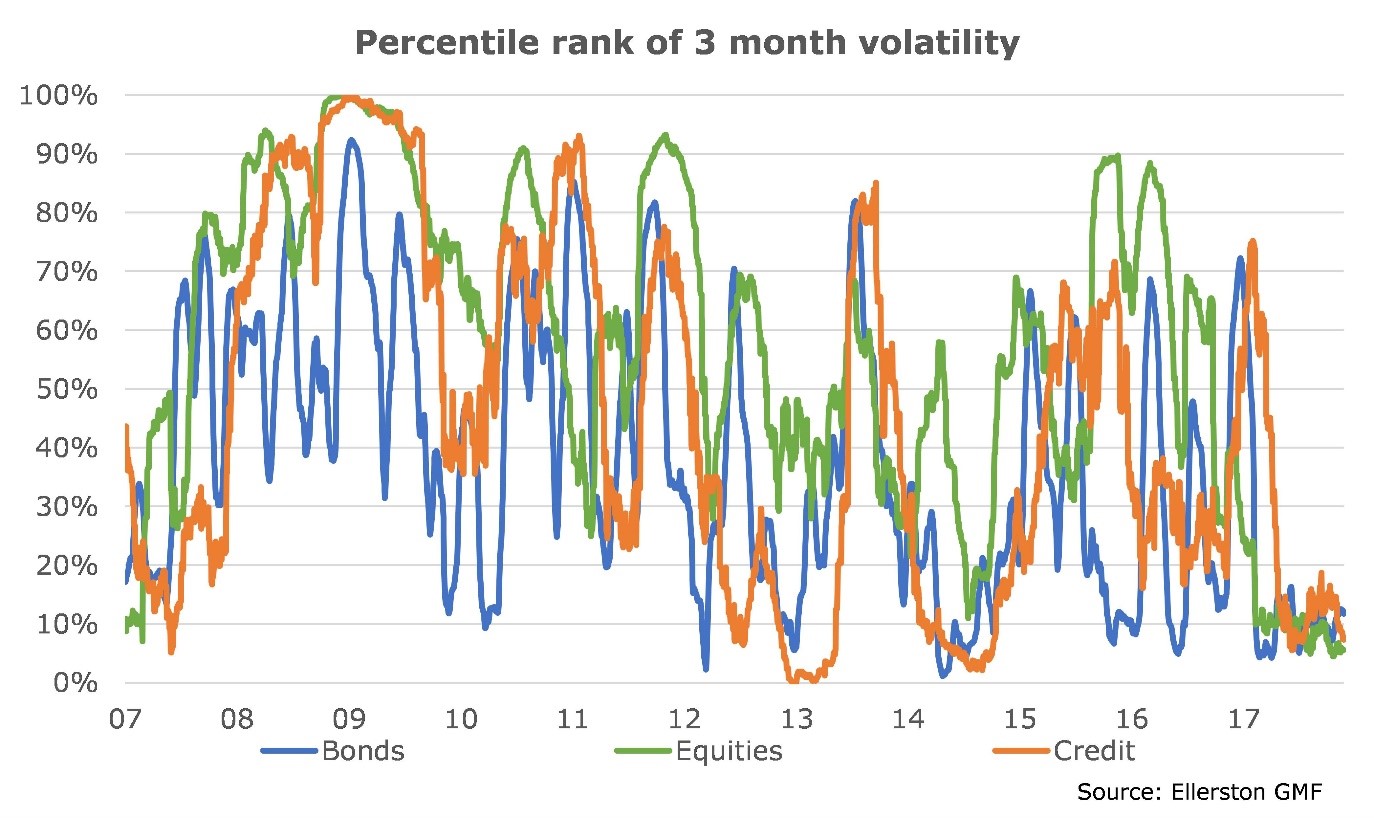
Exhibit 4: Record lows in dispersion in cross asset class volatility
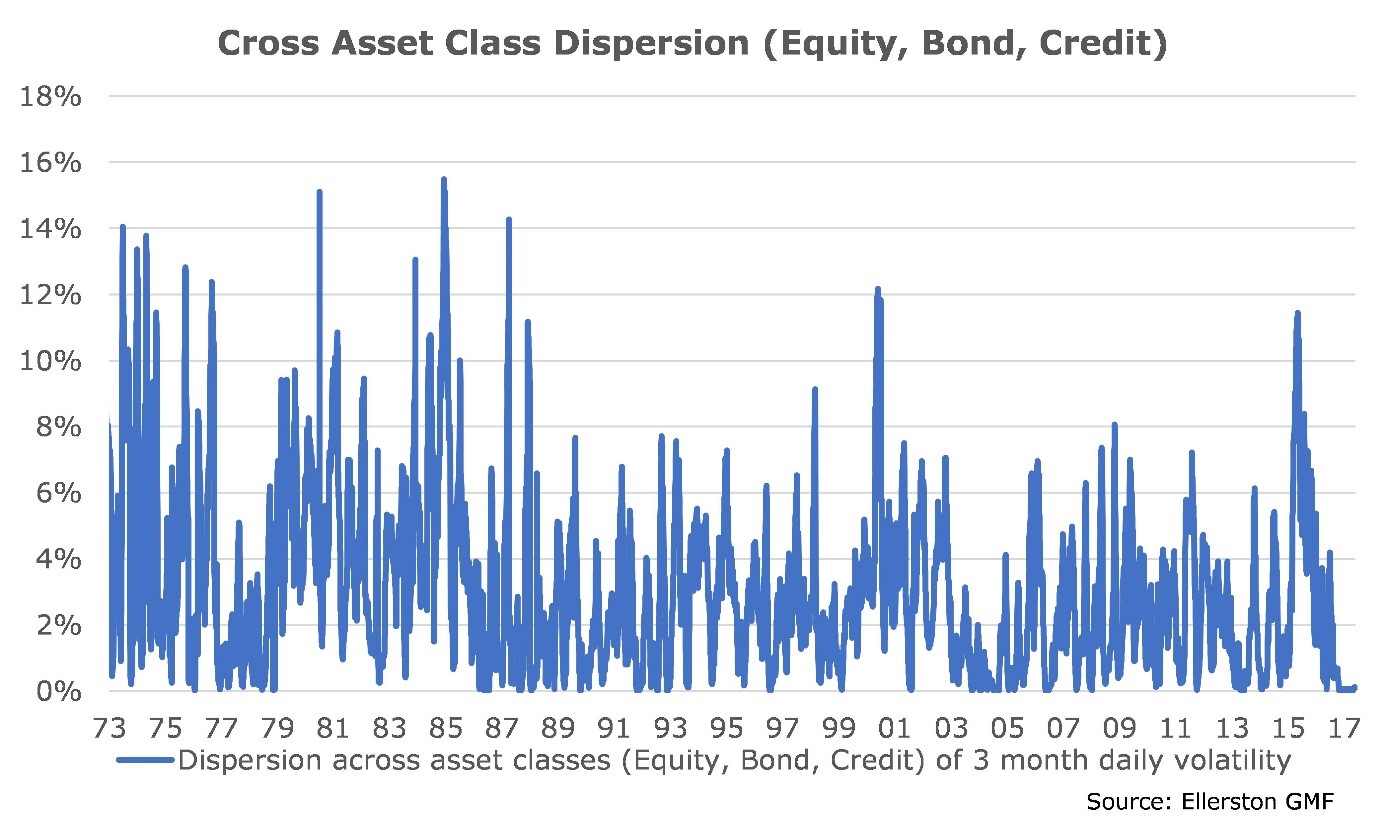
Indeed, Exhibit 4 shows that the dispersion between equities, bonds and credit is at a record low and for a record length of time.
The ‘Great Moderation’ was a phrase originally coined by economists Stock and Watson in 2002 to describe reduced US macroeconomic volatility observed from the mid-1980s. In economic terms the Great Moderation was thought to have lasted from 1987 to 2007. The reasons for the moderation were partly attributed to the trend towards independent inflation targeting central banks, better application of counter cyclical fiscal policy, less reliance on the cyclical manufacturing sector, more flexible labour markets, greater deployment of technology, improved corporate management practices and old fashioned ‘good luck’.
The phrase has since been adopted in financial markets to describe extended periods of declining asset class volatility. From an asset class returns perspective the mid-1980s did see a downswing in volatility, however, there have been 3 larger periods of declining cross asset class volatility since 1970; the late 1970s, the mid-2000s and the current period. As 2017 draws to a close, what is clear is that we are not just living in a low volatility environment, we are currently living through the ‘Greatest’ of the ‘Great Moderations’ for asset class volatility.
Low volatility requires dangerous degrees of leverage for volatility targeting funds
“…And we both know hearts can change….”
What should be apparent from all 4 exhibits above is the strong mean reversion tendency in the history of asset class returns. Often the switch from a low volatility environment to a high volatility environment can be violent and these periods are particularly painful for traditional asset classes.
One would have more faith in avoiding a sharp rise in volatility if there was a readily explainable explanation for why asset class volatility is plumbing new lows. The IMF in their recent Financial Stability Report had a stab at estimating a model for the VIX using a combination of explanatory variables such as macroeconomic variables, financial risk variables, corporate balance sheet health and liquidity conditions. Somewhat disconcertingly, the IMF’s model does a good job explaining the level of the VIX since 2004, however, a wide gap has opened up over the past 18 months between the model estimate and the low level of the VIX.
Exhibit 5: The IMF’s model of the VIX suggests current low volatility is hard to explain.
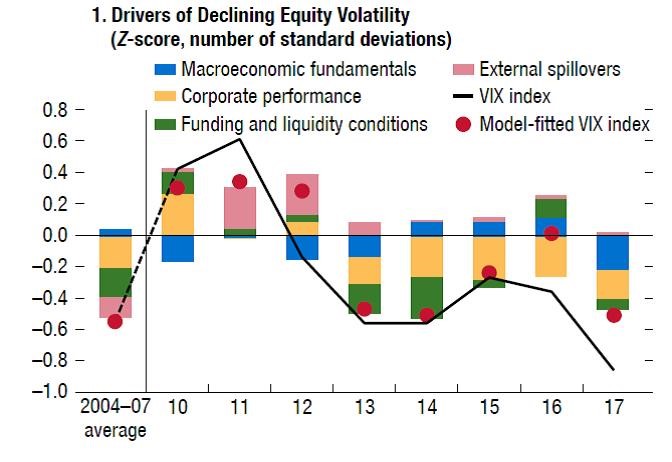
Obviously the model is either incorrectly specified or volatility will soon start to rise. The most likely reason for why volatility is suppressed more than can fundamentally be explained is that there has been tremendous fund flow into volatility targeting investment strategies. The IMF estimates there is approximately US$830bn in volatility targeting strategies that they can detect. It is not known how much additional money is invested in similar strategies by sovereign wealth funds and in-house pension funds globally.
Exhibit 6: The IMF estimates there was ~US$830bn invested in volatility targeting funds in mid-2017.
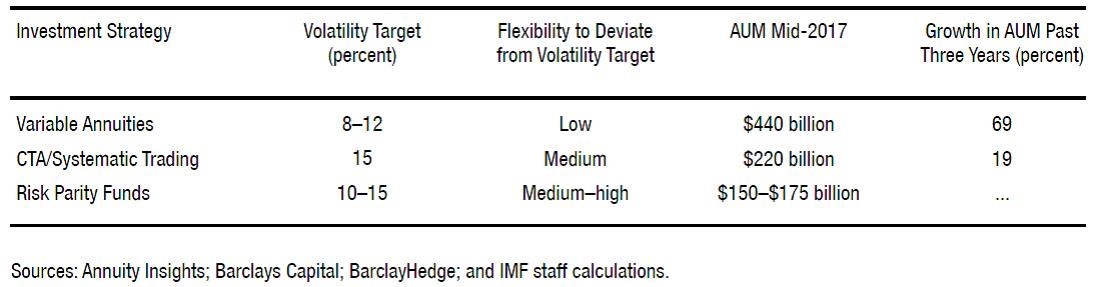
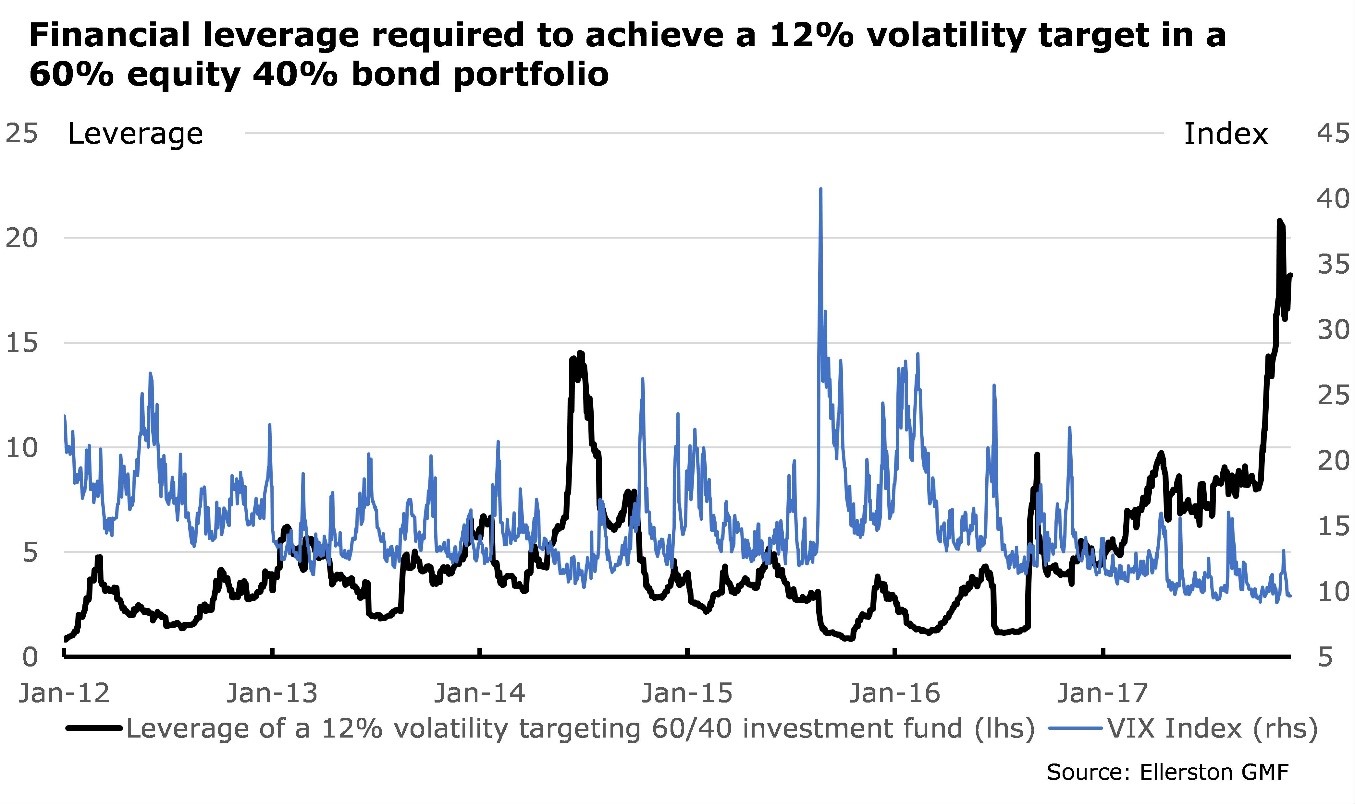
It is also unclear how much discretion in aggregate fund managers who employ this strategy have to deviate from the volatility target but it appears that variable annuity funds have little discretion and these funds are approximately half of the assets in low volatility strategies. Herein lies the problem. The IMF data suggests the average volatility target of these funds is 12%. As Exhibit 7 shows, given the sharp fall in volatility recorded in recent weeks, in order to achieve a 12% volatility target to be realised a 60% equity and a 40% bond weighting would currently require leverage of an eye-watering 17 times!
Exhibit 7: The IMF’s model of the VIX suggests current low volatility is hard to explain.

While we doubt volatility targeting funds have adopted anything close to this level of leverage, we have little doubt that either volatility targeting funds will soon have to acknowledge that there is little prospect that they can meet their individual volatility targets without taking unacceptable risks (and therefore face redemption risk), or significant leverage has been building in the financial system unbeknown to most participants.
US equities party like its 1929 despite a 36 year bond market rally drawing to a close.
“…And it’s hard to hold a candle ….”
To gauge why this rise in implied leverage by volatility targeting strategies is a concern, consider the spike in the VIX in August 2015. This spike in volatility – attributed to the fears of China’s growth slowing and a devaluation of the RMB – was not the largest in recent years yet it was the largest since the European sovereign debt crisis in 2011. The IMF estimated that volatility targeting funds were forced to sell over half of their equity exposure in 3Q15 in order to deleverage their positions, an observation that is consistent with our calculation in Exhibit 7.
Now consider that since mid-2015 the assets under management in volatility targeting strategies has increased by at least 40% and if the volatility targets have not been dramatically reduced in recent months then financial leverage in these strategies would be up to 4 times higher than mid-2015. That is, if the August 2015 spike in volatility was repeated today, instead of the approximately US$1.2trn in selling of assets in a short period of time, the recent rise in leverage and surge in the size assets under management in the strategy would unleash up to US$7trn in selling of assets.
Our concern is that compounding the move lower during the next significant spike in volatility would be the other main shift within financial markets over the past decade – the relentless shift of funds from active management to passive management. Goldman Sachs estimates that passive investing strategies are now close to 40% of assets under management in the US and 20% in developed markets ex-US. This rise in passive investing has likely contributed to lowered liquidity in financial markets since the financial crisis, since on Goldman Sachs’ estimates, the turnover of portfolios in passive funds is 1/10th the size of that of active funds. Moreover, as volatility rises, the volume of transactions in the financial markets by ETFs also increases. ETF’s share of equity market turnover is approximately 16% of the tape when the VIX is ~12 but this rises to 28% when the VIX is ~20 and over 33% when the VIX exceeds 30. Putting aside issues of leveraged ETFs, and the illiquid underlying securities of some ETFs, it’s likely that the next major spike in volatility and the resulting reduction in risk assets will be amplified by the rise and rise of passive investing strategies.
It is not hard to envision a scenario where the combination of:
1. Record low volatility and record low dispersion across asset classes;
2. Rapid growth of funds in volatility targeting strategies;
3. Higher leverage deployed by volatility targeting strategies; and,
4. A surge in passive investment strategies
could pose a significant threat to financial markets upon the next significant rise in the VIX. Yet, we believe it is likely that the vast majority of financial participants are at best only vaguely attuned to these risks or are choosing to ignore them as the bull market continues.
To be clear, we are not suggesting a dramatic adjustment in asset values is necessarily imminent. A slow and steady rise in volatility and a sensible reallocation to lower volatility targets, and indeed some shift in FUM back towards active investment strategies, would be beneficial and could avert a sharp market drawdown.
Nevertheless, we are struck by the similarity to the 1987 crash where volatility targeting strategies might act as the modern equivalent of portfolio insurance and ETFs may act as the modern equivalent of machine-based trading systems that helped amplify the correction.
Exhibit 8: Shiller’s Cyclically Adjusted Price Earnings Ratio is approaching the 1929 peak.
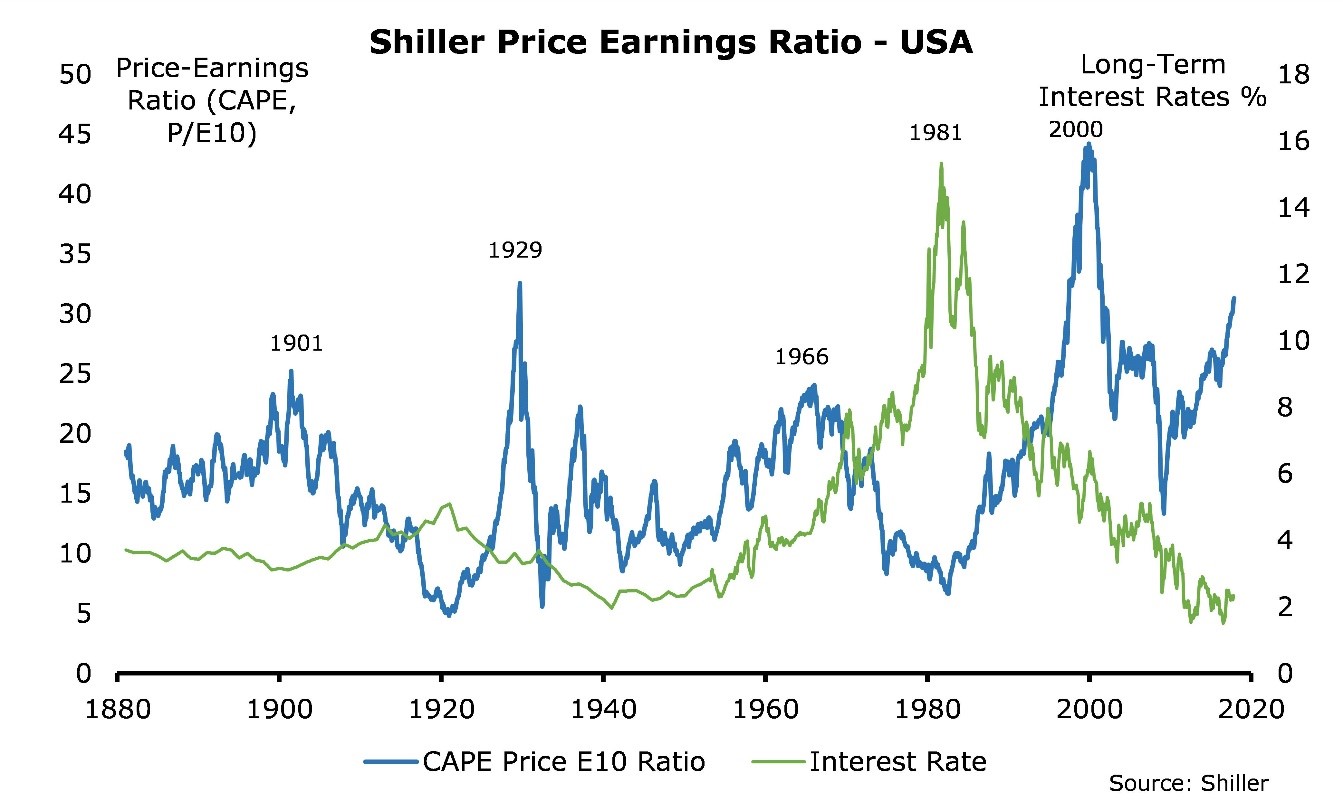
We are also struck by the valuation of the equity market. Although equities appear reasonably valued relative to spot bonds, the recent trajectory of the widely followed Shiller’s cyclically adjusted price earnings ratio is concerning. As at the end of October 2017 Shiller’s PER is double the level recorded ahead of the 1987 crash, and is currently closing in rapidly on the 1929 peak. Only the Dotcom boom eclipses the 1929 and 2017 booms in a dataset that commences in 1880.
Part of the reason for the rise in the Shiller PER is the boom in earnings pre-GFC have fallen out of the 10 year trailing average used in Shiller’s calculation. That is, the more recent readings for Shiller’s PER are likely a better estimate of the sustainable earnings path that investors are paying for. In concert, with the 20% total return year-to-date from the S&P500 we are now gaining a glimpse of just how overvalued the US equities market is on a cyclically adjusted basis.
Exhibit 9: US 10 year bonds are at critical technical levels. A bullish engulfing candlestick formation suggest upside risks to bond yields
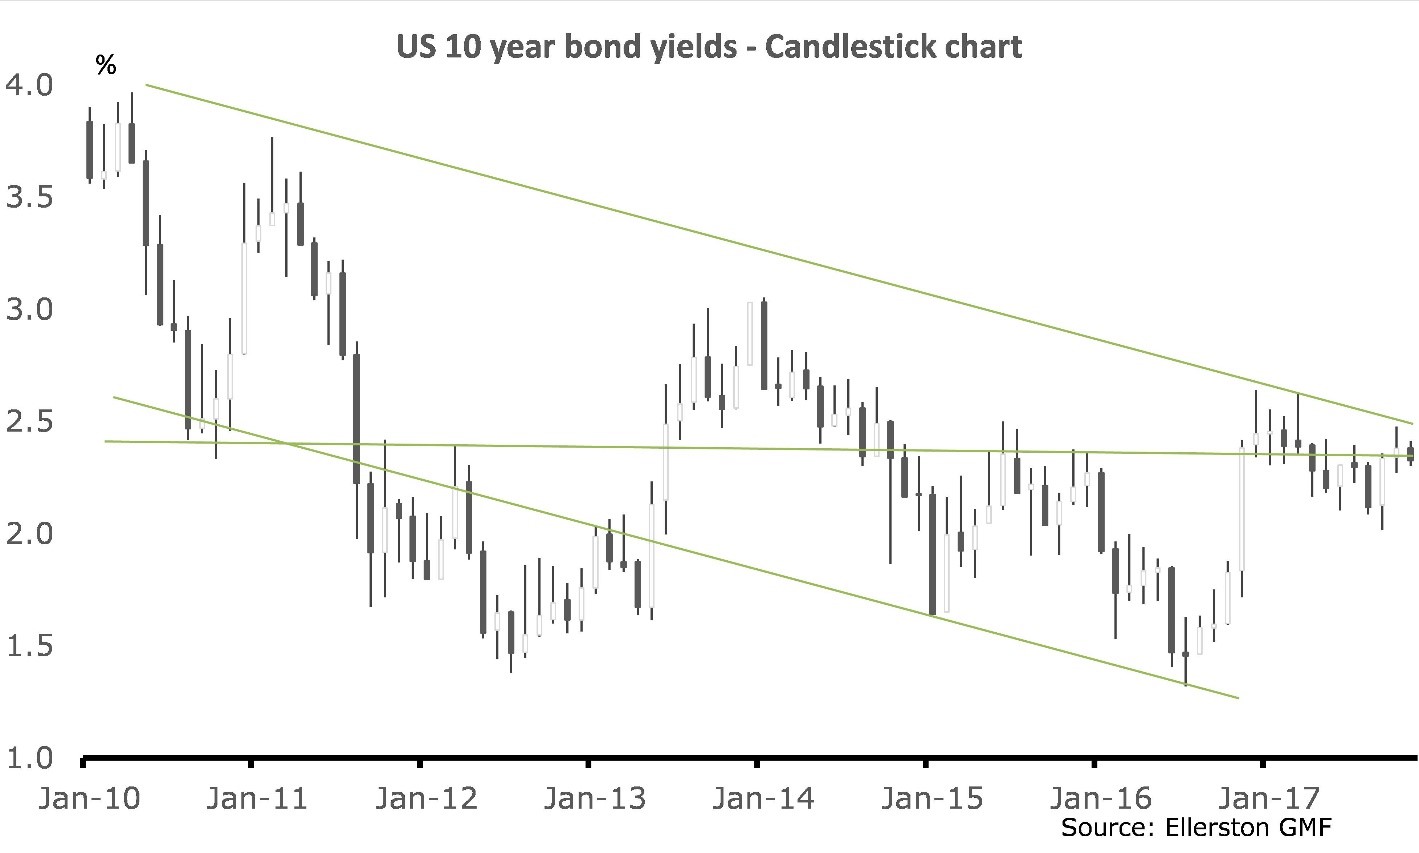
In the background, the US bond market continues to test the next big technical figure of 2.4%. Regardless of whether you subscribe to our analysis of rising US inflation and rising long dated bond yields as QT takes greater effect in 2018, even the most rusted-on bond bull would have to question whether US 10 year bond yields have broken their 36 year-long rally. Should yields break above 2.4% in coming weeks 10 year yields will have broken above their 100 month moving average for the first time since 2007 and the death warrant on the generation long bond rally will likely be more formally issued. For those that believe in watching candlestick formation charts, Exhibit 8 shows the move in US 10 years yields since 2010. Long white candles in the exhibit indicate when bond bears are dominating the trading environment and it is clear that the modest rally in bonds through 2017 began to unwind in September and to a lesser degree during October. The evidence in November is more mixed, yet it is worth noting that December is strongest seasonal month for US 10 year yields. A break above 2.4% may well set the scene for a more significant move towards 3%.
While that may not sound like a large move in the context of the bond market history it is worth remembering that the average duration for bond managers has moved significantly higher in recent quarters such that a 100bp rise in bond yields would translate into a 7% drag on performance. If you are invested in a risk parity fund that holds between 60-75% of its portfolio in bonds and corporate credit, and leveraged those bonds to deliver ‘equity-like’ returns, then the risk of a much bigger drawdown would be in prospect.
Insuring against a storm
“…In the cold November rain….”
At the conclusion of November, bond, equity and credit markets remain at historic low volatility, valuations on all three asset classes are abnormally stretched and the parallels to the financial market conditions that led to the Black Monday crash are uncomfortable. With respect to the latter, the combination of high asset class valuations, a liquidity diminishing trend to passive investing and financial innovation in the guise of volatility targeting (which has likely distorted measured volatility in asset prices and added a new layer of leverage) poses a tangible risk to financial market stability on any significant spike in volatility.
Strong global economic growth, low inflation, aggressive provision of central bank liquidity, strong forward guidance and an unrelenting search for yield have been some of the factors that have generated current market conditions. In this regard there are also some similarities to 1987. The economic backdrop of the second half of the 1980s was marked by excess liquidity, courtesy of financial innovation rather than deliberate central bank policy, and global economic growth was robust and accelerating. Coincidently, Fed Chairman Greenspan was confirmed by the Senate two months prior to the crash; in the week before the crash the House of Representatives filed legislation to remove M&A tax benefits; and four days ahead of the crash Iran fired missiles at two cargo ships which had ties to the US. The main difference between the two periods has been the behaviour of inflation.
An acceleration in inflation in the period ahead may well be a catalyst for a rise in volatility, however, this is not a necessary condition – volatility can rise for a multitude of reasons. Historically, a rising unemployment rate, a decline in the ISM, and unanticipated interest rate increases have been economic factors that have led to rising volatility. Of course, geo-political events, financial stress events, corporate scandals and simply shifts in market psychology can be more important in driving financial market volatility than shifts in economic variables. By their very nature these are very difficult to identify in advance of the event.
What we can say, with a high degree of conviction, is that it is statistically highly unlikely that volatility will stay this low for too much longer. We have positioned for a higher volatility environment and are alert to the risks that rising volatility poses to our core positions of strong global industrial growth and rising US interest rates. Similar to the 1987 crash, a sharp rise in volatility and asset price resets need not be the harbinger of an economic downturn nor the end of the rate tightening cycle. Indeed, we believe that the broader global economic growth cycle is sufficiently robust to withstand a temporary shock to volatility, and the broader industrial recovery could continue for another couple of years. As such, policy rates in the G10 are still more likely to be calibrated higher rather than remain around current settings. Even if volatility settles into a higher range in coming months, we believe any significant spike in volatility is still likely to prove somewhat transitory.
For now, the clear blue sky mentality of financial markets has continued. Yet our indicators suggest the economic humidity is rising, and in that environment, financial market thunderstorms are often hard to see in advance. From a personal perspective, a thrice flooded garage from unusually powerful thunderstorms in recent weeks, encouraged an upgrade in my house insurance earlier this month. We have done the same with our portfolio.
“…And when your fears subside, and shadows still remain,
I know that you can love me, when there’s no one left to blame,
So never mind the darkness, we still can find a way,
‘Cause nothin’ lasts forever, even cold November rain.”

Written by Tim Toohey
The Ellerston Global Macro Fund is an absolute, unconstrained strategy investing in a number of fundamentally derived core themes, optimised via trade expression and portfolio construction across Fixed Income, Foreign Exchange, Equity & Commodities. It focuses on capital preservation while providing low to negative correlation to traditional asset classes. Find out more here
Never miss an update
Enjoy this wire? Hit the ‘like’ button to let us know.
Stay up to date with my current content by
following me below and you’ll be notified every time I post a wire
Livewire Exclusive brings you exclusive content from a wide range of leading fund managers and investment professionals.
5 topics
1 contributor mentioned
Livewire Markets
Livewire Exclusive brings you exclusive content from a wide range of leading fund managers and investment professionals.
Expertise
Livewire Markets
Livewire Exclusive brings you exclusive content from a wide range of leading fund managers and investment professionals.
Expertise
Comments
Comments
Sign In or Join Free to comment
most popular
Investment Theme
If 24 LICs ran the Melbourne Cup, which ones would we back?
Affluence Funds Management