TOL - 14th Jan, 2021
Return of the explorer
After a year many would describe as the most challenging in recent memory we are optimistic on the human spirit bouncing back in 2021. Whether it be reigniting the passion for travel, embarking on a life changing move, or simply being inspired by Cobra Kai to learn Karate we see 2021 as a year of personal exploration.
“Exploration is really the essence of the Human Spirit” Frank Borman
With increasing market commentary that we are at the start of a structural bull market in commodities, we also believe 2021 may mark the first year of a bull cycle in commodity exploration. Here in we discuss our reasons for this, what it may mean and provide some insights on how to play it.
Why we could be at the start of an Exploration upcycle
- Recent exploration success stories. Chalice Mining (+1633%) and DeGrey (+1890%) were the two best performing ASX stocks of 2020. Success breeds confidence and also FOMO as investors dream of what could be the next big name to hit the billboards. The recent increase in junior capital raisings(1) is testament to this.
- Commodity price strength. In a year that contained a global pandemic it was almost amazing to see a host of commodities deliver record price growth. Gold +25%, Copper +26%, Iron Ore +72%. With the image below an approximate representation of global exploration spend by commodity, strength in these 3 provides the ability (via FCF) and confidence (via management and investor capital allocations) to invest in the drill bit.
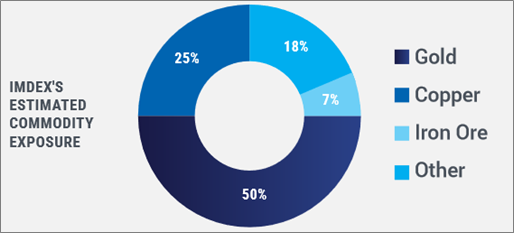 Source: Imdex 2020 AGM Presentation
- Historic underspend. Wood Mackenzie has suggested the gold industry alone must invest USD54bn by 2025 on greenfield projects and mine restarts just to maintain production at current levels.
- New age of electrification. The electrification of the global transportation fleet and increased demand for energy storage provides a strong backdrop for investing in new supply of commodities like copper, nickel, lithium, cobalt, rare earths, etc.
- Globally co-ordinated fiscal stimulus targeting infrastructure. Governments globally have spent over USD10trn since the onset of the COVID-19 pandemic.
What does an Exploration upcycle look like?
We view S&P Global’s Market Intelligence report(2) as the best reference to global exploration spend. It represents a comprehensive survey of current and projected budgets from over 3,600 mining companies operating over 6,000 mines. The graph below summarises this data for the last 25 years.
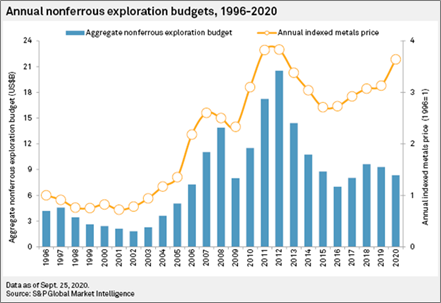
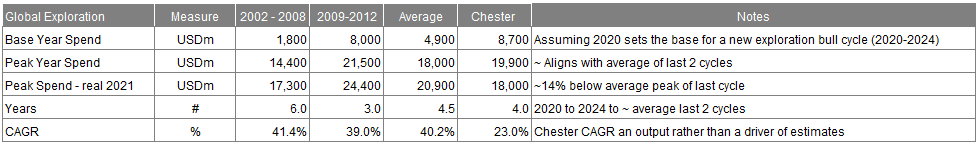
S&P’s latest 2020 estimate is USD8,700m in expenditure, ~11% below 2019 levels. If accurate it would actually represent a material upgrade to the 29% decline projected in April 2020. Early indications have S&P Global projecting 2021 growth at ~20%, which we expect would be 2H weighted. Hence the upcycle may have already begun. But what might it look like past 2021? We believe the average of the 2 most recent up cycles (2002-2008) and (2009-2012) provide the best guide to what this potential upcycle may look like. We have averaged these 2 below which form our base case of global exploration spend in coming years. I.e., Chester’s base case is a 4-year bull cycle in exploration peaking in 2024 at ~USD20bn.
 Source: Chester Asset Management, with data from S&P Global Market Intelligence
How to Play
We break down opportunity into 5 separate categories which we work through from bottom (least risky) to top (most risky) through the rest of this paper.
- Pure greenfield opportunities – very high risk without the appropriate skills
- Pure play explorers that have made discoveries – resource delineation and development plays
- Established producers with underappreciated exploration upside
- Pure play service companies
- Service companies with some exploration exposure
A Leveraged Services Exposure - ALQ
ALS Limited (ALQ) is the largest and most liquid way to play a potential bull market in exploration. ALQ provides analytical testing services globally across 3 key segments being Life Sciences (Environmental Services ~70%, Food ~20% and Pharma ~10%), Industrials and Commodities. Given the topic of this paper below we have only focused on the (cyclical) Commodities division which represented ~50% of FY20 earnings (pre corporate costs). This division consists of Geochemistry, Metallurgy, Inspection and Coal with the majority of earnings (Geochem and Met) predominantly exploration driven. Summarised below are the division’s results since 2009.
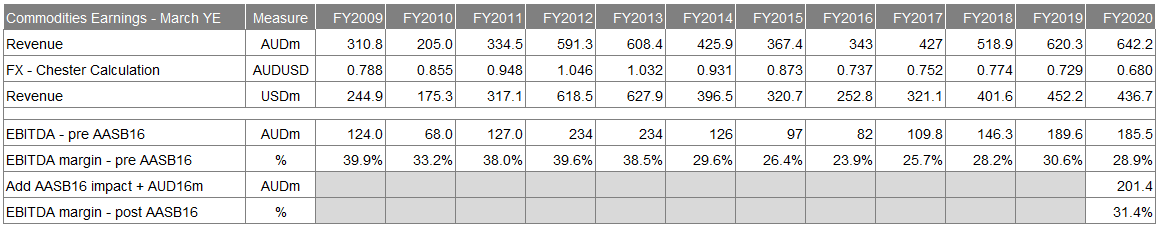
Source: Chester Asset Management with data sourced from ALQ financial reports
Although ALQ’s Commodities division is more than just non-ferrous exploration we have compared results with S&P Global data to calculate ~ALQ market share since 2010. Per below we estimate ALQ’s revenue has averaged ~4.5% (pretty consistently) of global exploration spend over the past 5 years.
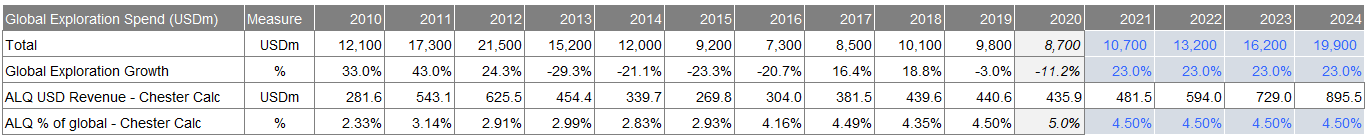
Source: Chester Asset Management, S&P Global Market Intelligence
Despite calculations suggesting a higher level in 2020, we have applied this ~4.5% average against our top-down model of global exploration spend to derive projected revenue for ALQ. To that we have applied similar margins to the last up-cycle (refer above) to project earnings for ALQ. Our analysis is tabled below.
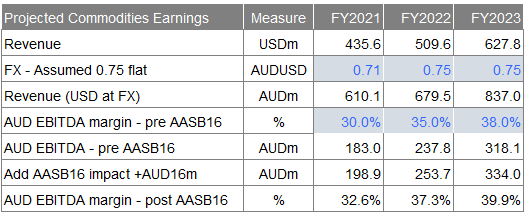
Source: Chester Asset Management
We have compared our projections to those of a handful of sell-side analysts (3).
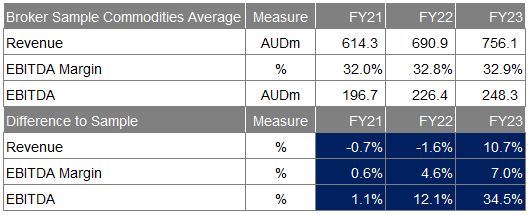
Sources: Chester Asset Management, Various anonymous broker reports
Notably 3 quarters of FY22 for ALQ is in 2021 for which we assume the sell side has largely relied on S&P’s 20% growth estimate and hence there is limited deviation to FY22 revenue forecasts. However, if we are in an exploration upcycle, we see opportunity for upgrades to FY23 revenue and margins. We have shown projections to only FY23 as comparison is only really available to then but as discussed previously based on our assumed cycle for exploration this jaws would continue / expand into FY24 and FY25. Note we see it reasonable in an upcycle margins would materially expand, based on:
- mix benefits - higher proportion of more profitable greenfield (including juniors) exploration;
- operating leverage – high degree of fixed costs in operating labs; and
- price rises.
Given the more predictable nature for the remainder of the business, Commodities earnings represents the key area of divergence between these projections and consensus for ALQ.
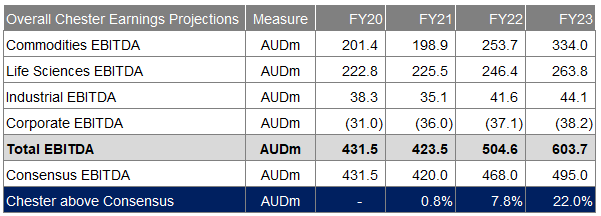
Sources: Chester Asset Management, IRESS
A ‘Pure-play’ Services Exposure - IMD
Imdex (IMD) is almost a pure play exploration service company so is an appealing play on a potential exploration bull cycle, but IMD is also exposed to the theme of increased technology adoption in the mining industry. By way of background IMD’s business in FY2019 was split ~55%/45% between specialised drilling fluids (historically called AMC) and 45% instrumentation (historically called Reflex). These operate across 3 geographical divisions being Americas, Asia Pacific, Africa / Europe. Previously 100% of IMD’s business was with drilling contractors but this is moving more to direct to resource companies (currently ~20%) to drive higher engagement and share of wallet. IMD are increasingly encouraging clients to connect to what is known as IMDEXHUB-IQ, a cloud-based information hub which allows exploration work streams to operate in the cloud. ~60% of top 100 clients are connected to IMDEXHUB-IQ and these clients are estimated to spend 60% more than non-connected clients. In addition, IMD is at various stages of rolling out new technologies which expand the company's total addressable market, including beyond just exploration. Status on 3 of the 4 key technologies (in August 2020) are pictured below. BlastDog (4) being the 4th technology, combined with aiSIRIS expands IMD’s offering into production.
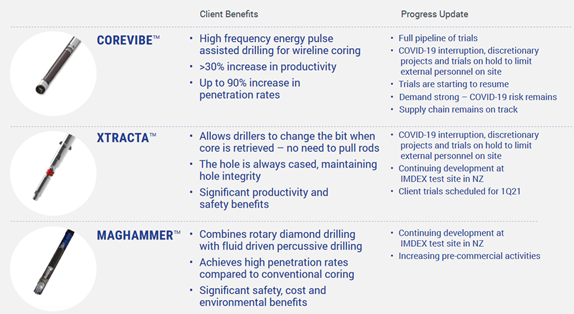 Source:
Imdex FY2020 Results Presentation
Source:
Imdex FY2020 Results PresentationBelow we have compared S&P’s data for global exploration spend to IMD’s historical revenue. What we notice is that similar to ALQ, IMD’s revenue has remained a reasonably consistent share of global exploration spend at ~1.8%.
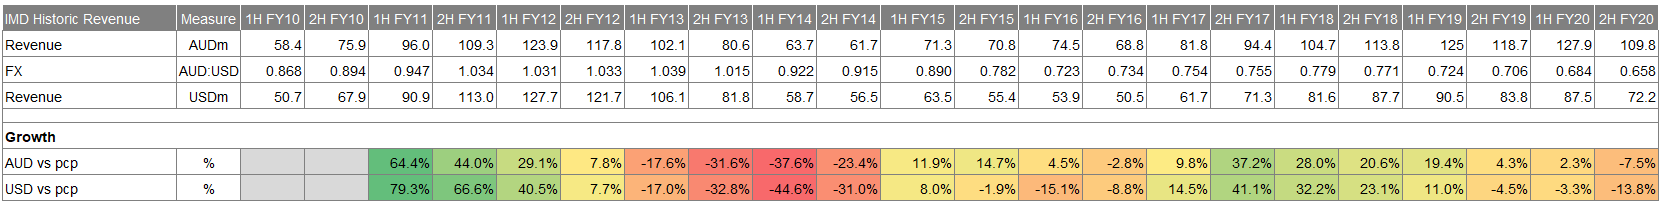
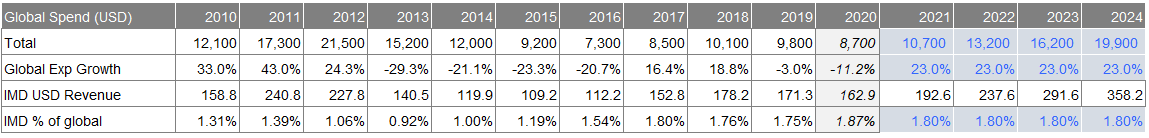
Sources: Chester Asset Management, S&P Global
Despite IMD commentary they are winning market share our base case for their core business is they retain market share at 1.8%. We have tabled what the implied revenue would mean for IMD under our top-down global exploration spend scenario and compared this to consensus for FY21 to FY23.
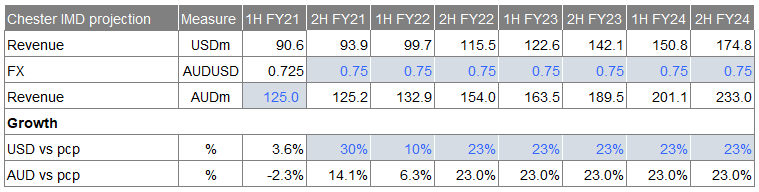
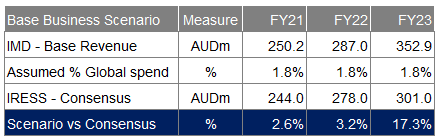 Source: Chester Asset Management
Additionally, we have developed adoption scenarios for the 4 new technologies above with a view this revenue is incremental to IMD’s base business. If correct our reference case for IMD’s revenue is comfortably above consensus. Notably the higher margin instrumentation side of the business, including these new technologies, is seeing greater growth so in addition to operating leverage we see favourable mix providing opportunity for margin expansion.

Sources: Chester Asset Management with consensus revenue sourced from IRESS
Based on our top-down scenario, if an exploration upcycle plays out we see opportunity for material IMD upgrades from FY22 and beyond.
Established Producers with Underappreciated Exploration Upside
Similar to diversified industrials that attract a conglomerate discount exploration plays within established producers are quite often undervalued compared to pure play exploration companies. Hence with a valuation bias when we consider commodity investments one of our preferred ways to gain exposure to exploration is via attractive plays within established producers.
Below we have tabled a list of some names we are watching. This is by no means a complete list but rather a watchlist of some names we see as interesting. To avoid doubt we have chosen to present these in alphabetical, rather than preferential/upside order.
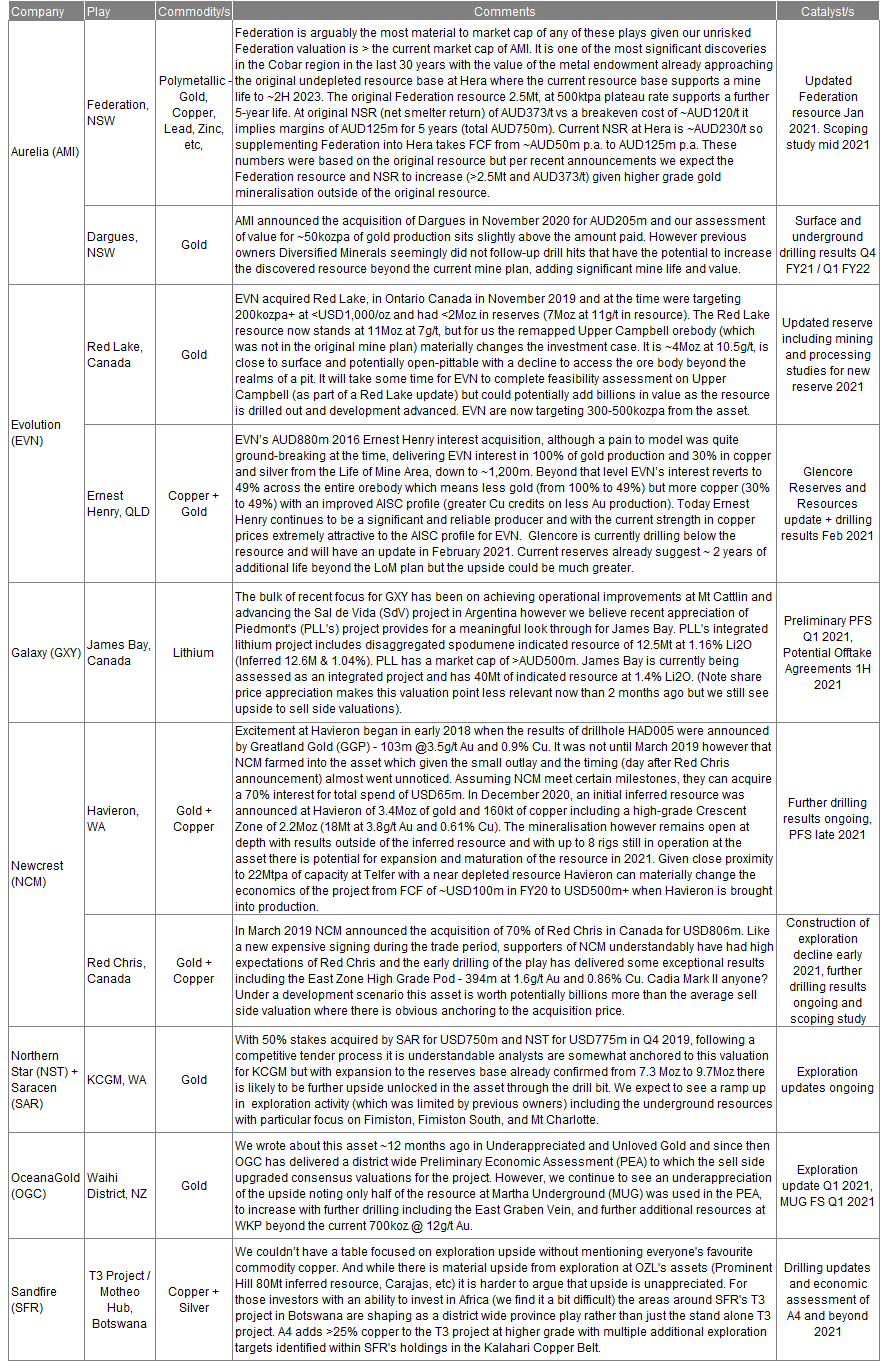
Resource Delineation / Development Plays
Finding existing discoveries that are progressing through the resource delineation phase is far less risky than swinging at pure greenfield explorers but anyone who has invested in this end of the curve or watched the movie Gold will understand there are unique risks in doing so. It is quite an art to capture the value of the de-risking phase while trying to avoid the pre start-up ‘orphan period’. We find the picture below extremely useful in summarising the lifecycle of a mineral discovery.
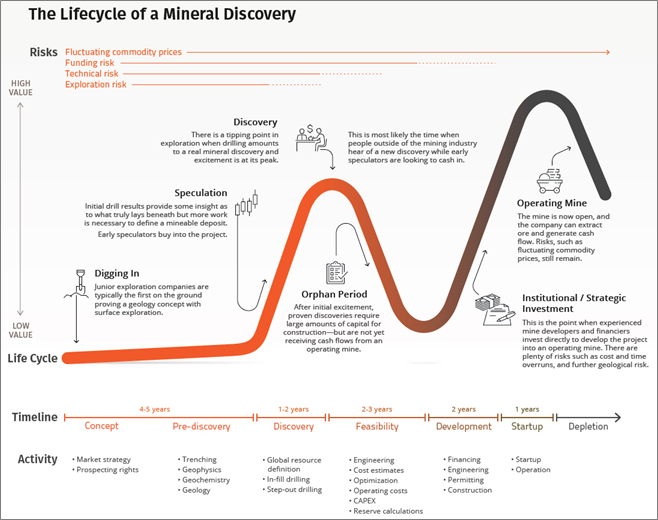 Source:
the Visual Capitalist
Source:
the Visual CapitalistBelow we have provided somewhat of a watchlist of plays we are tracking in this category, again in alphabetical order.
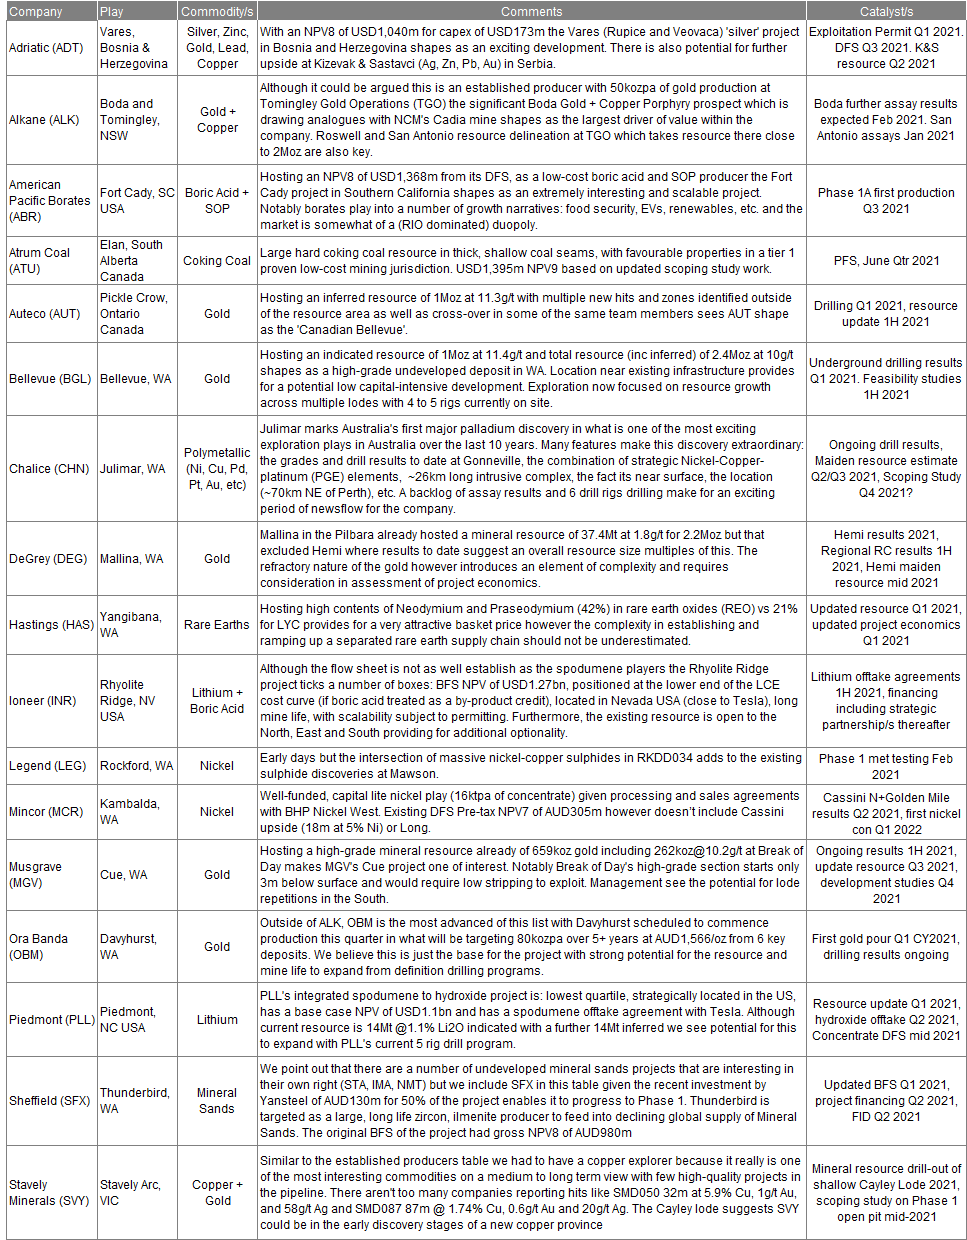
Pure Explorers (including Greenfields)
This is the pointy end of exploration and the less we say about this space the better. Picking winners here is a bit like this writer's golf game, in my spare time I infrequently have a swing and every now and then one comes off but that is the exception not the norm. In the meantime, I am more than happy to take tips from the pros!
Conclusion
Get out there and get exploring.
Not already a Livewire member?
Sign up today to get free access to investment ideas and strategies from Australia’s leading investors.
Footnotes
(2) Which despite being only non-ferrous exploration is the best representation of global spend
(3) We have used analyst reports from 7 sell side analysts. Note not all analysts presented EBITDA, where this wasn’t available we grossed up EBIT projections to EBITDA using the D&A of the Commodities division in FY2020 of (AUD37m)
Never miss an update
Enjoy this wire? Hit the ‘like’ button to let us know.
Stay up to date with my current content by
following me below and you’ll be notified every time I post a wire
Chester Asset Management is a high conviction equities fund manager co-founded in 2017 by Rob Tucker and Anthony Kavanagh, with a 25-40 stock benchmark unaware strategy comprised of predominantly broadcap (ASX300) stocks.
........
Past performance is not a reliable indicator of future performance. Positive returns, which the Chester High Conviction Fund (the Fund) is designed to provide, are different regarding risk and investment profile to index returns. This document is for general information purposes only and does not take into account the specific investment objectives, financial situation or particular needs of any specific individual. As such, before acting on any information contained in this document, individuals should consider whether the information is suitable for their needs. This may involve seeking advice from a qualified financial adviser. Copia Investment Partners Ltd (AFSL 229316, ABN 22 092 872 056) (Copia) is the issuer of the Chester High Conviction Fund. A current PDS is available from Copia located at Level 25, 360 Collins Street, Melbourne Vic 3000, by visiting chesteram.com.au or by calling 1800 442 129 (free call). A person should consider the PDS before deciding whether to acquire or continue to hold an interest in the Fund. Any opinions or recommendations contained in this document are subject to change without notice and Copia is under no obligation to update or keep any information contained in this document current.

2 topics
26 stocks mentioned

Chester Asset Management is a high conviction equities fund manager co-founded in 2017 by Rob Tucker and Anthony Kavanagh, with a 25-40 stock benchmark unaware strategy comprised of predominantly broadcap (ASX300) stocks.
Chester Asset Management is a high conviction equities fund manager co-founded in 2017 by Rob Tucker and Anthony Kavanagh, with a 25-40 stock benchmark unaware strategy comprised of predominantly broadcap (ASX300) stocks.
Comments
Comments
Sign In or Join Free to comment