The riskiest sector in the ASX200 index

Olivier d'Assier
Axioma
Just how risky is the Materials sector? That’s the question we sought to answer as we dive into one of Australia’s largest industries. We use Axioma’s Multifactor Australian Risk Model to map the sector’s risk characteristics, style footprint, as well as the type of investment opportunity it offers investors.
We started by creating monthly portfolios beginning in 2002, and then screened the index for all stocks in a given sector on a monthly basis and weighted the stocks using the index’s weights. For each sector, we have calculated numerous risk-related statistics, including risk levels, style factor exposures, contributions to variance, and intra-sector correlations. We also looked at valuation levels, performance data and inter-sector correlations.
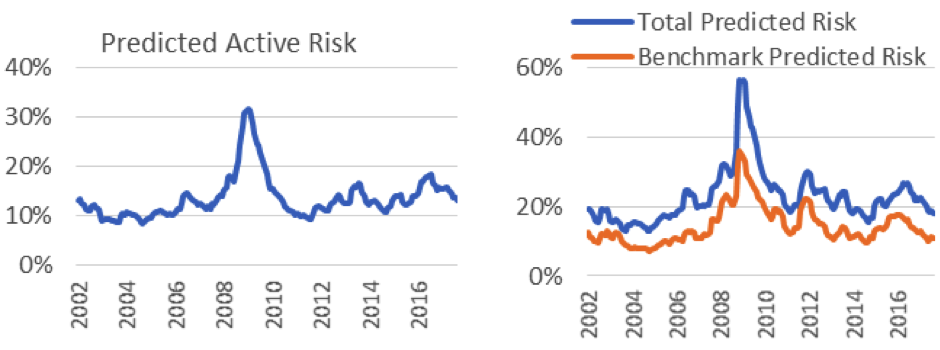
Figure 1 shows the predicted tracking error of our Materials portfolio against the index, as well as the predicted volatility of the sector and the index independently. The chart on the left indicates that the Materials sector has been deviating more and more from the index since 2012 remains well above its long-term average of 12.3%*. Globally, benchmark risk is at or near historical low volatility, and while this is also the case for the index, the Materials sector remains stubbornly higher risk than its low reached in 2004.
Figure 1 – Predicted Tracking Error and Volatility
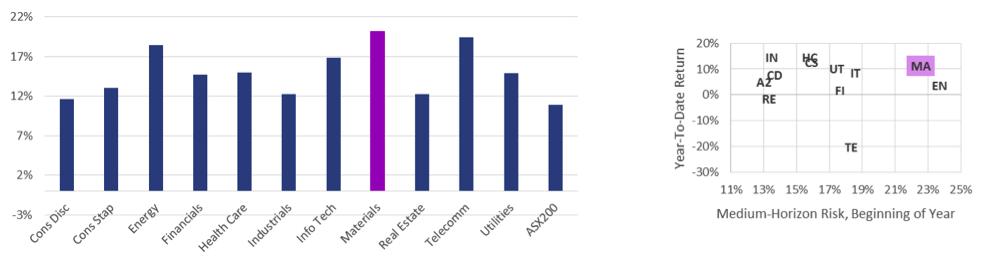
Not only is our Materials portfolio riskier than the index, it is currently the riskiest sector in the index. On a year-to-date basis, only the Energy sector has been risker. Figure 2 compares the predicted volatility of each of the sector portfolios in the index as well as the risk/return tradeoff they provided investors since the start of the year. As the chart on the right shows, many sectors would have provided a better risk/return tradeoff for investors this year, including Industrials (IN), Health Care (HC), Consumer Staples (CS), Consumer Discretionary (CD), and Utilities (UT). Only the Energy (EN) Sector, Telecomm (TE), Financials (FI) and Real Estate (RE) would have provided a worst one.
Figure 2 – Predicted volatility and YTD risk/return tradeoff for all sectors
This is nothing new for this sector. When comparing the sector’s contribution to the overall index risk versus its weight in the index, Materials has constantly been a riskier contributor throughout its history than its weight might suggest.
Next we take a look at the style footprint for the sector. Not surprisingly it is very sensitive to movements in Emerging Markets and Exchange Rates. As noted above it also has a higher sensitivity to Volatility than other sectors. Figure 3 compares the sector’s exposure to Value and Growth style factors with other sectors**.
Figure 3 – Value and Growth style factor exposures across sectors
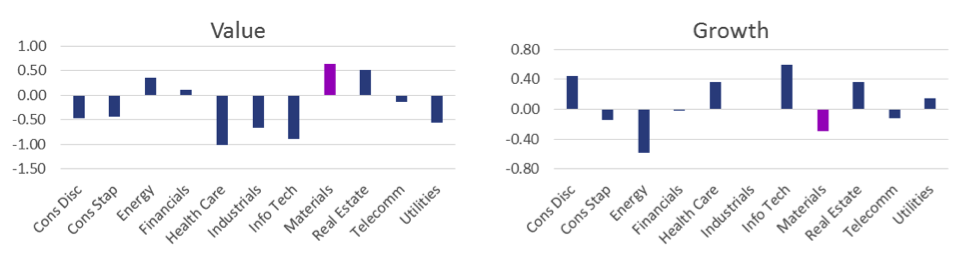
Materials currently has the highest Value style exposure but the second lowest Growth style one of all the sectors in the index. Value investors would therefore want to overweight this sector while growth investors might want to underweight it or avoid it altogether.
Investors wishing to overweight the Materials sector will need to take its riskiness into consideration and look for ways to mitigate its influence on portfolio risk by hedging it through sector allocation. Figure 4 below shows some of the sector’s strong correlations with some of the other sectors. Materials is strongly correlated with the Energy sector (who knew, right?), so an overweight in both sectors will only increase portfolio risk. On the other hand, Materials and Financials are very negatively correlated with each other and this relationship has been persistent through time. An accompanying overweight in Financials will therefore help to reduce overall portfolio risk where an existing overweight in Materials exists.
Figure 4 – Significant Inter-Sector Correlations
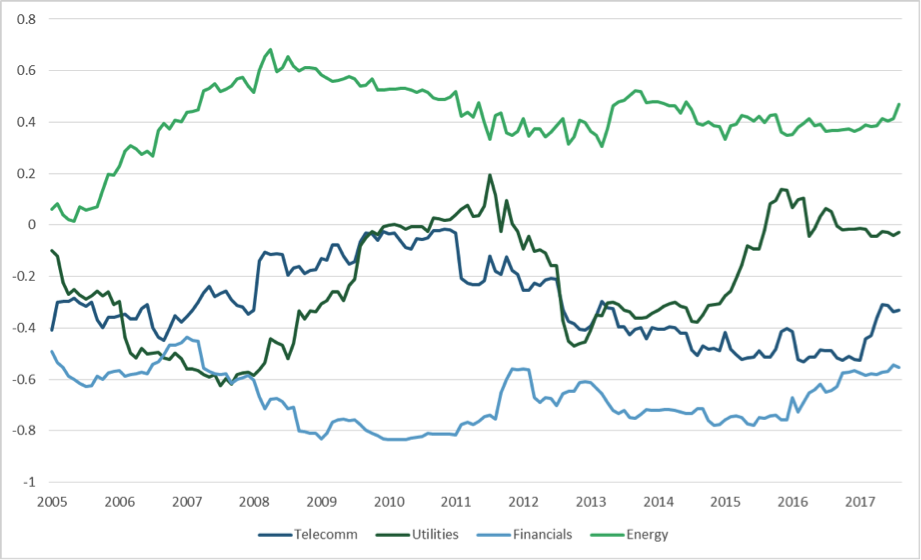
Interestingly the sector’s correlation with Telecomm and Utilities has co-varied through time, becoming negatively correlated and neutral with Materials around the same periods, until 2015. Currently, Telecomm provides another good hedge to an overweight in Materials, while Utilities has been neutral since the end of 2015. Investors also interested in these two sectors would do well to monitor this relationship as Materials’ correlation with these two sectors varies strongly through time.
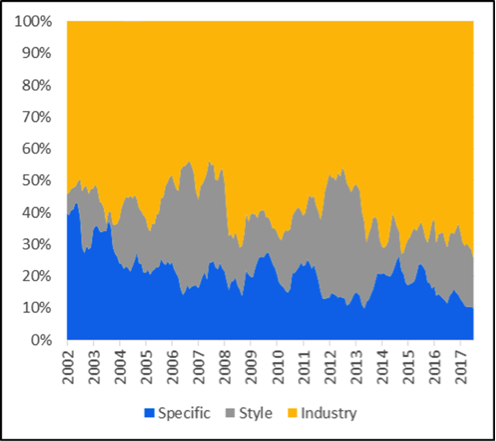
Finally, we take a look at Materials from the point of view of investment style and ask whether it represents a good opportunity for stock-pickers to apply their skill. We decompose the predicted tracking error of the sector vis-à-vis the index into its three main component blocks - Industry risk, Style risk, and Stock Specific risk – and ask what is driving the sector’s risk? Figure 5 shows the breakdown since 2002. Industry risk has been the major driver for Materials since the start, and increasingly so over the years. Most of that increase has come at the expense of Stock Specific Risk. Since stock-picker bet on company specific news rather than industry-wide ones in order to differentiate between winners and losers within each sector, the Materials sector does not represent a good opportunity set for them as its returns are for the most part driven by industry-wide news and not company specific ones. Materials represent a better opportunity set for investors with a top-down asset allocation styles and sector-rotation strategies.
Figure 5 – Contribution to tracking error for Materials
In summary, Australia’s Materials sector is not your grandmother’s sector. It packs more punch than other sectors in terms of risk, and is dominated by overseas news (especially from emerging markets) and exchange rate movements, requiring investors to keep a close eye on global macroeconomic and geopolitical events. While it is a good place to gain exposure to Value, the only way to reduce the risk contribution to your portfolio is by hedging it with an exposure to other sectors (in particular Financials and Telecomm), as the sector is largely driven by industry risk and does not offer much stock selection opportunity by way of stock dispersion. It is strongly correlated with the Energy sector, another good source of Value exposure, so keep that in mind when building a Value strategy, as you may need twice the hedging.
*: The long-term average was computed excluding the 2008-2009 financial crisis years. It is 13.6% inclusive of these outliers.
** These exposures are expressed as Z-Scores and the index average is zero.
Never miss an update
Enjoy this wire? Hit the ‘like’ button to let us know.
Stay up to date with my current content by
following me below and you’ll be notified every time I post a wire
Olivier d'Assier is Head of Applied Research, APAC, for Axioma and is responsible for generating unique regional insights into risk trends by leveraging and analyzing Axioma's vast data on market and portfolio risk. d'Assier's research helps clients and prospects better understand and adapt to the evolving risk environment in Asia Pacific.

5 topics
1 stock mentioned
Olivier d'Assier
Managing Director, Applied Research - APAC
Axioma
Olivier d'Assier is Head of Applied Research, APAC, for Axioma and is responsible for generating unique regional insights into risk trends by leveraging and analyzing Axioma's vast data on market and portfolio risk. d'Assier's research helps...
Expertise
Comments
Comments
Sign In or Join Free to comment