The stockmarket season is changing
Following on from the popular post on the seasonal turning point for the VIX last week, here's an insight into seasonality for the S&P500. The chart shows 2017 superimposed on the historical average price movement across the year, and it looks like a fairly decent fit, with the implication being that the next couple of months will bring a bearish bias.
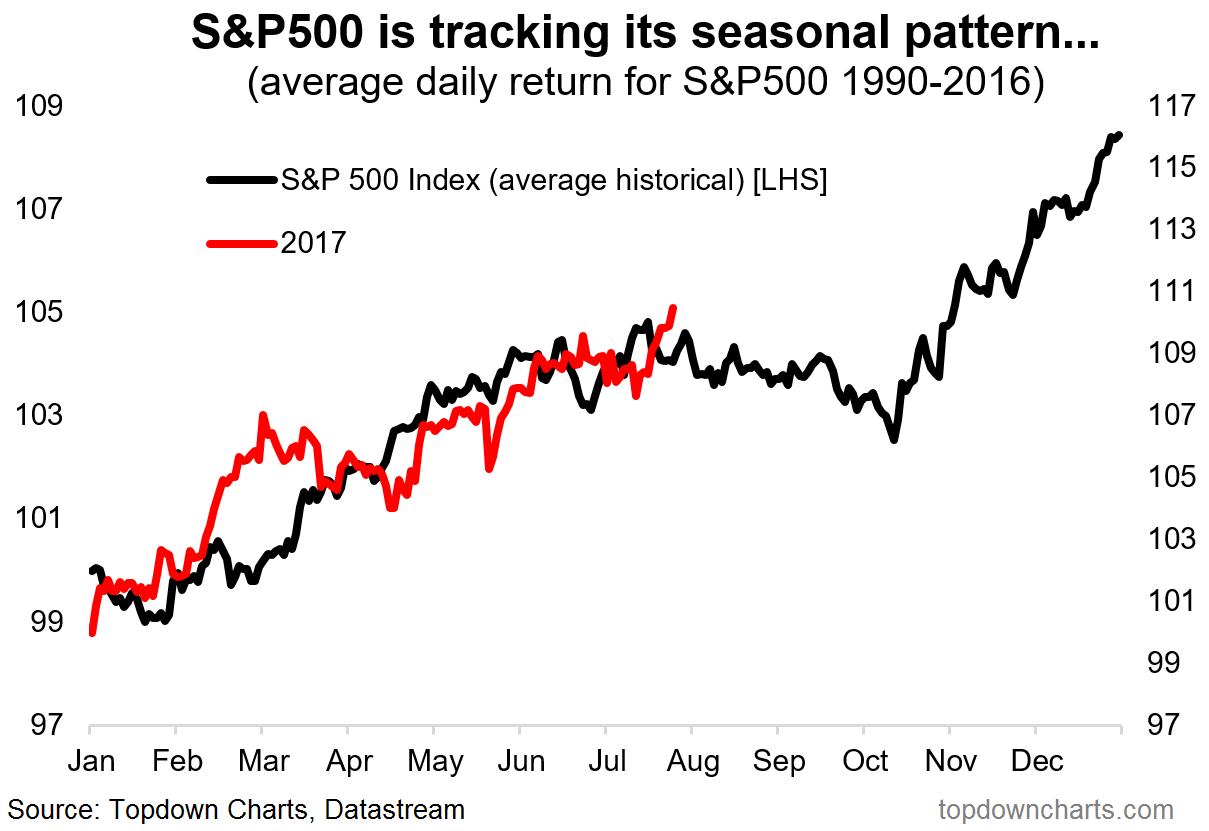 The rule of thumb for seasonality is you don't want to rely on it, but incorporate it as one factor among many into your investment process. For example, if you said S&P500 valuations are expensive, the Fed is hiking rates, lending standards have tightened somewhat, investor sentiment is increasingly bullish/complacent, and there are a few geopolitical risks lurking in the shadows, and then pointed to the negative seasonality that has historically characterized the July-October period, you might come to a conclusion that the risk of a correction is elevated short term...
Never miss an update
Enjoy this wire? Hit the ‘like’ button to let us know.
Stay up to date with my current content by
following me below and you’ll be notified every time I post a wire
Callum is Head of Research at Topdown Charts.
Topdown Charts is a chart-driven macro research house covering global Asset Allocation and Economics.

4 topics

Callum is Head of Research at Topdown Charts. Topdown Charts is a chart-driven macro research house covering global Asset Allocation and Economics.
Expertise
Callum is Head of Research at Topdown Charts. Topdown Charts is a chart-driven macro research house covering global Asset Allocation and Economics.
Expertise
Comments
Comments
Sign In or Join Free to comment