This recently triggered market signal has never failed to predict gains
The 1987 stock market crash, the GFC, COVID and now Trump’s trade war. What do they have in common?
Extreme levels of share market volatility. In big and/or fast share market sell-offs, we see that “volatility clusters”. The market doesn’t fall in a straight line. The very best and worst days on the market are not spread out like needles in a haystack. They more likely sit, like those on a blind first date, uncomfortably side by side.
Why?
In a word – “uncertainty”. Uncertainty has skyrocketed and investors are struggling during these periods to work out what is the right market reaction.
You can see this clearly below, where we show the daily market moves in the world's most followed share market index, the S&P 500.
The U.S. share market has gone up about 10% p.a. long term, which over ~250 trading days a year, means on average it goes up about 0.04% a day. Of course, it’s never so calm that it goes up that amount every day. If it did, it would cease to be as risky, and you wouldn’t get anything like a 10% p.a. long-term return.
It’s in part because you occasionally get these days where it goes up +5% or -5% intraday, you get rewarded by higher long-term returns in the share market. Stomaching uncertainty, volatility and occasional big daily swings is the price you pay – and the prize inside is an asset class with the highest long-term returns.
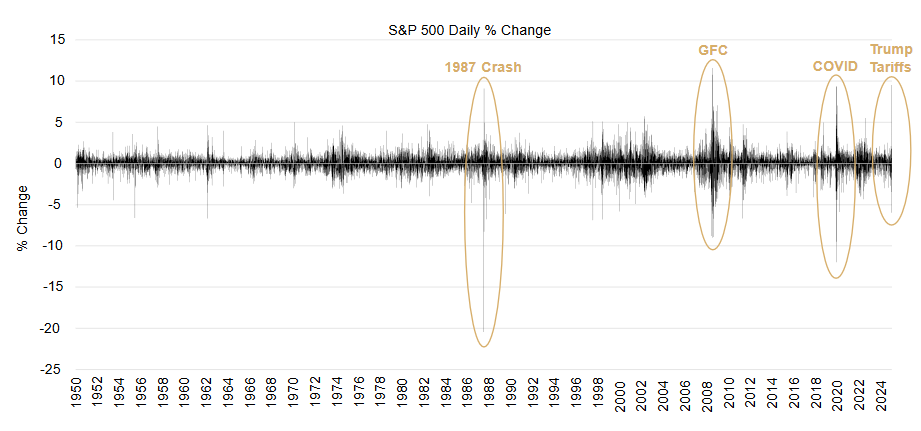
Markets had already started becoming more volatile in February and March as Trump’s initial tariff moves on China, Mexico and Canada spooked investors with his 2 April Liberation Day “big daddy” reciprocal tariff announcement looming.
The Art of the Tariff Deal
As widely reported, 2 April didn’t go well for investors. The following two trading days saw the S&P 500 down about -5% and -6% respectively. Basically, the fastest “correction” (>-10% fall) in history, outside of COVID.
Investors were struggling to comprehend the size of the tariffs announced by the U.S. on its trading partners (and some islands only inhabited by penguins! – story link).
The tariffs were much bigger than virtually anyone expected, and if implemented, would take the U.S. average tariff rate on imports from less than 3% in 2024 to a little over 25% – a level not seen for over a century! Effectively, this would unwind 100 years’ worth of global trade liberalisation. A very big deal and why the market puked in response.
Of course, what Trump claimed – that he was placing reciprocal U.S. tariffs on countries that imposed tariffs on U.S. goods – was far from reality (see chart); in fact, it simply reflected the size of the U.S. goods trade deficit with those countries.
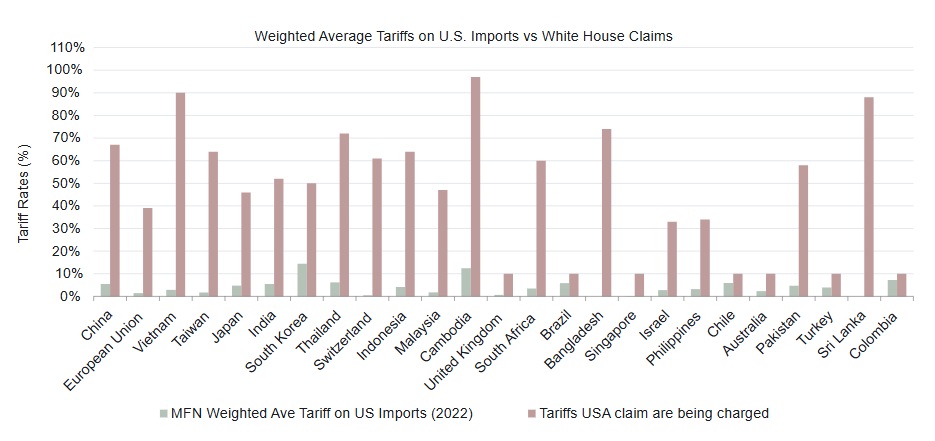
Perhaps this was just the typical Trump playbook of starting with a maximal opening offer to gain leverage in negotiations for better trade deals. We should all hope this is not the end position!
Deal or No Deal – the countries you should care about
As trade uncertainty at writing in mid-April looked to have peaked (at least for now) with Trump pushing back reciprocal tariffs for those countries above the 10% minimum baseline rate by 90 days (except for China), the market breathed a big sigh of relief staging an almighty +9.5% S&P 500 rally on the day. Subsequently, Trump has also announced some tariff carve-outs for tech equipment imports, such as laptops and smartphones, and also the possibility of concessions for the auto industry.
But does this mean the worst is over for markets from Trump’s trade war?
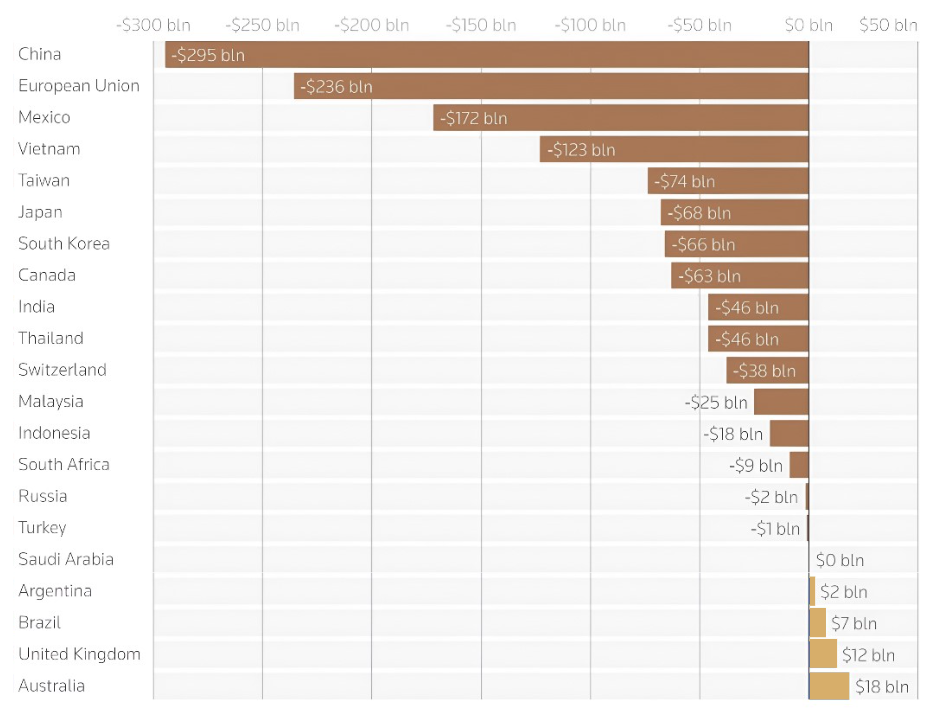
Maybe. However, it’s still far from clear. The biggest “offenders” in Trump’s mind are those countries with the biggest goods trade deficit. As shown below, China, Europe, Mexico and Vietnam stand out. Trade deals with smaller deficit countries will no doubt be hailed as successes by the U.S., but won’t really move the dial in the trade war. Ultimately, what happens with the big deficit countries like China, which retaliated and now each face over 100%+ tariffs on goods trade, is the main game.
Chart: US goods trade deficit or surplus with major trading partners in 2024
Trump blinks
Probably the most important piece of information for investors post Liberation Day was that Trump is willing to course adjust and back off when pushed.
So, what made Trump blink – pausing the reciprocal tariffs for 90 days and adding carve-outs for certain sectors and products?
It’s the market that bats 1,000 to use a baseball term – the bond market. In the second week of April, the U.S. 10-year yield rose 0.5% to about 4.5%. A weekly rise that large hasn’t been seen since November 2001! (A bygone era where Sony Discmans were the rage and the first Harry Potter movie had just been released).
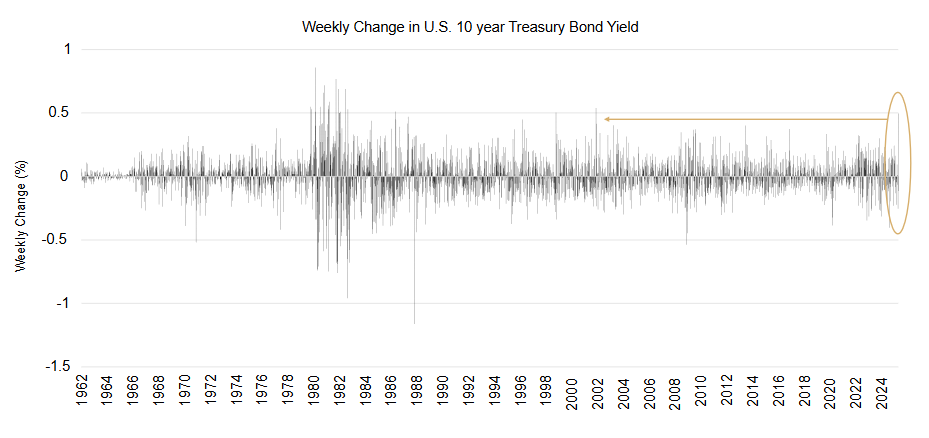
Remember the U.S. runs a momentous US$2tr fiscal deficit (6.3% of GDP) alongside its trade deficit. That fiscal deficit must be financed through issuing debt, so Trump, and particularly Secretary of the Treasury Scott Bessent, are very sensitive to escalating debt costs to fund that deficit and the U.S.’s growing US$36tr debt pile. It might not be as sexy and lucrative as the share market, but you can bet the bond market still knows how to scare the most powerful man in the world, especially when debt interest costs make up the largest expense in your budget.
That’s not to say it was all beer and skittles for share investors recently.
How bad did it get for shares?
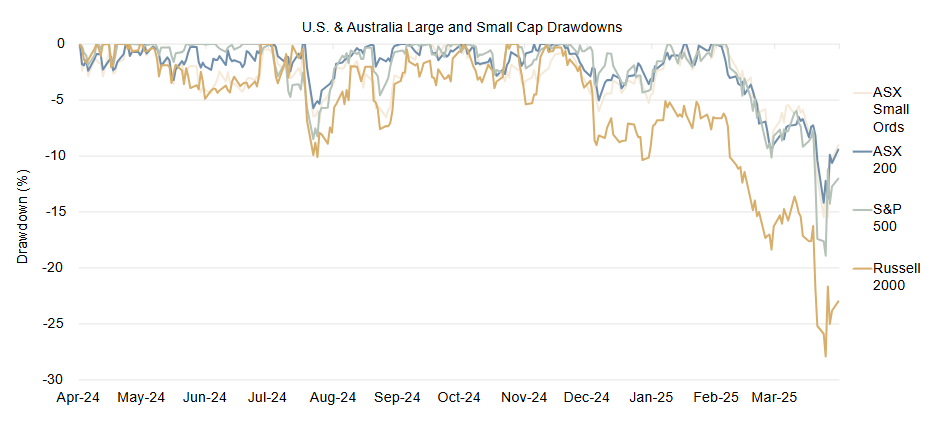
Below we show the drawdown (peak to trough fall) for U.S. and Australian Large and Small Caps. What’s clear is that U.S. small caps (Russell 2000) copped it the hardest, entering into bear market territory (>-20% down) and just shy of a -30% fall before the partial recovery. This is interesting because U.S. small caps have had a median drop of -36% during the six U.S. recessions since 1980 for which we have data. In other words, they fell about ¾ of the typical decline seen in a recession. However, despite the trade war, the U.S. has yet to experience a recession—and may still avoid one. (At writing, Polymarket currently places the probability of a U.S. recession in 2025 at 53%.)
The S&P 500 fell -19% by early April, roughly 80% of the way toward its median decline of -24%, calculated from the twelve U.S. recessions for which we have data, dating back to World War II. So, things got pretty rough. Australian Large and Small caps faired relatively better, falling near -15%, but are now less than -10% off their highs. This, in many ways, makes sense as the U.S. represents less than 4% of Australia’s total exports (and less than 1% of GDP), as well as having received the equal lowest announced tariff rate of 10% on Liberation Day.
The bigger worry for Australia is any slowing down in China, Australia’s largest export destination by far, as it gets targeted by the U.S., given its huge trade surplus.
What we’ve been doing
What does all this mean for us at Ophir and how we are managing our Funds in response?
Firstly, our Global Funds that are most directly impacted from recent tariff announcements. This is a result of those funds being about 60-65% allocated to U.S. based companies (in line with our benchmark) who are either at tariff risk to increase their costs of goods sold if they have supply chains going through newly tariffed countries, or from less purchasing power of consumers for their goods if tariff costs are passed on more generally to them.
Non-U.S. companies in our Global Funds, mostly European and U.K. businesses, if they sell into the U.S. may also find they are able to sell less volume or see margins squeezed as a result of the new tariffs.
It also means businesses impacted by tariffs are likely to pull back on capital expenditure and hiring until they know where the tariff end state is likely to be. There is a wide range of scenarios from a more mild increase to inflation and decrease to economic growth and corporate earnings in the U.S. – in which case the bottom of this sell-off has likely been seen – to something more sinister like a U.S. recession this year and stall growth globally.
We are not making a big, bold tariff or macroeconomic call either way.
We have been around long enough to know that is not where our edge in investing is.
And it’s been proven time and again for those who think it is that the vast majority have no edge here. Famed economics professor Paul Samuelson’s great quote, “the stock market has predicted nine out of the last five recessions,” is ringing in our ears. Even the economics team at Goldman Sachs suffered some recession call whiplash – dropping it 73 minutes after declaring it (story here).
We always want to let our bottom-up stock picking do most, if not all, of the talking.
That said, we have been making some incremental changes to portfolio positioning in reaction to what has been happening over the last 2-3 months, without making any big heroic forecasts. In response to evidence of slowing U.S. growth and tariff risks we have been positioning a little more defensively in our Global funds. Some of the key ways we have done this, for example, are through cutting exposure to stocks in the cyclical Consumer Discretionary sector and increasing exposure to those in the more defensive Health Care sector. These generally haven’t been in new names but rather by moving the weights in existing companies that we do like. From February onwards, we’ve also deliberately adjusted upwards the Cash allocation in the Global Funds from less than 5% to closer to 10%.
We have also been careful to limit binary direct tariff risk to stocks in our funds, as we don’t want President Trump’s thoughts on tariffs to be the primary determinant of whether we outperform or underperform.
Some hope ahead
This month’s Letter has mostly covered all the risks that the U.S.’s approach to tariff policy has introduced to the global economy and markets. And to be sure, we still don’t know the final outcome. But one reason for optimism over the next few years comes from the table below.
The VIX index, or more formally the CBOE Volatility Index, which measures the market’s expectation of volatility for the S&P 500 over the next month, recently broke through 50. This index is often called the “fear gauge” as it shoots up when investors get panicky.
In calm times, it spends most of its day relaxing around the 10-15 level. Very very rarely does it get above 50, like it did on 8 April this year. Historically, it’s been a good contrarian indicator for when to invest. As Buffett says, “Be greedy when others are fearful, and fearful when others are greedy”.
Chart: Volatility Index ($VIX) - Historical Closes Above 50 (1 January 1990-8 April 2025)
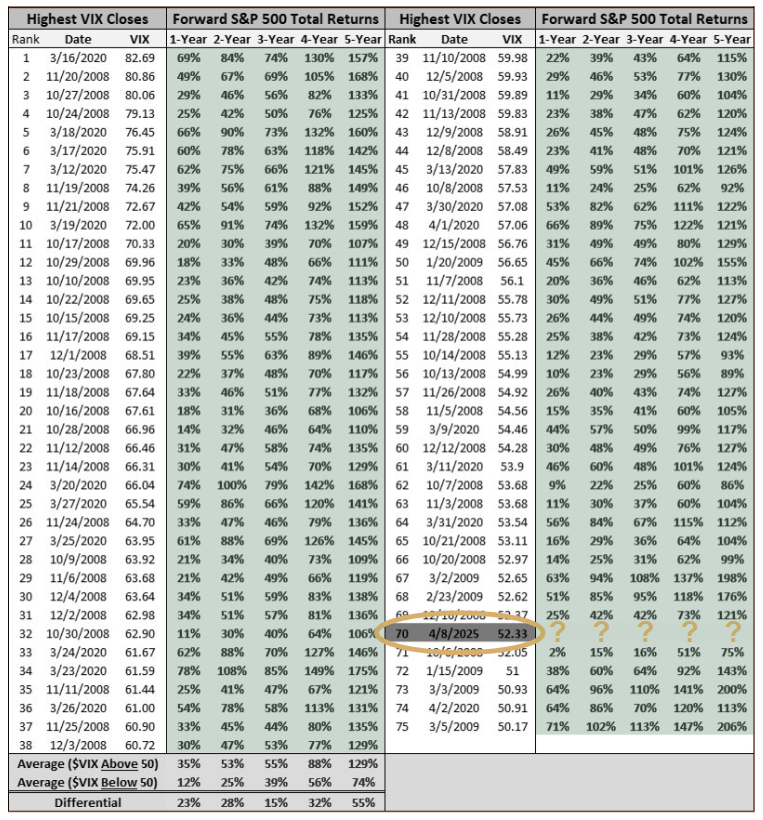
Every time the VIX has closed above 50, S&P 500 returns have been positive over the next 1-5 years. Also, the average 1-year return is 35%, far higher than the average 12% returns earned when investing while the VIX is below 50. Does this guarantee success? No. All of these periods were during the GFC (2008/09) or COVID (2020). But getting scared away when markets have fallen is more than likely the wrong thing to do. It’s trite but true: time in the market beats timing the market.
We have chosen to mitigate as best we can some direct tariff risk through analysing our portfolio companies’ supply chains and making a small number of changes where those risks were too high. We have also incrementally dialled back the risk a little in our Global Funds, increasing our allocation to more defensive growers that are less reliant on strong economic growth globally.
To us, this, along with staying invested, remains the best course of action. Share markets have weathered worse trade wars before, and they will do so again.
In times of market uncertainty I always remind friends of my favourite Buffett quote: “In the 20th century, the United States endured two world wars and other traumatic and expensive military conflicts; the Depression; a dozen or so recessions and financial panics; oil shocks; a flu epidemic; and the resignation of a disgraced president. Yet the Dow rose from 66 to 11,497.”
Back the productive capability of good businesses. It wins time and again.
If you would like to sign up to the monthly Ophir newsletter and see what stocks we are buying and selling and our views on these turbulent markets, sign up here.
3 topics

