What's driving markets right now?

Clime Investment Management
Clime Investment Management
In this article we look at some of the more topical subjects influencing financial markets and analyse a few interesting charts. We start with rising rates – the message being delivered by the Federal Reserve’s Janet Yellen in uncharacteristic straightforward terms. Then we cast an eye over President Trump’s tax plans. We briefly examine Australia’s largest ever infrastructure project, the troubled NBN, and show how it has failed to deliver, especially relative to global competitors. Lastly, we look at a chart of Bitcoin’s rise and rise, and wonder whether it is in bubble territory.
Amidst all the noise of geopolitics – how does one avoid Trump and North Korea, Brexit negotiations, the rise of the far-right in Germany, secession talk in Catalonia, forthcoming elections in Japan – global share markets continue to grind ever higher. Unfortunately, the same can’t be said for the Australian share market, which has been stuck in a tight range for 9 months. In fact, the ASX/S&P 200 Index was 5,667 on 3 January 2017, and as we write today, the Index is trading at 5,707 (up a mere 40 points, or less than 1%). On the domestic front, business and consumer confidence is half-hearted at best, electricity prices keep on rising, the Supreme Court is debating Section 44 of the Constitution, and the politicians in Canberra appear unable to chart a credible path forward.
Incidentally, while we fret about “Little Rocket Man”, South Korea’s sharemarket doesn’t seem too fussed by Kim Jong-un. South Korea’s KOSPI Index over 12 months... is maintaining recent highs, and performing far better than the ASX!
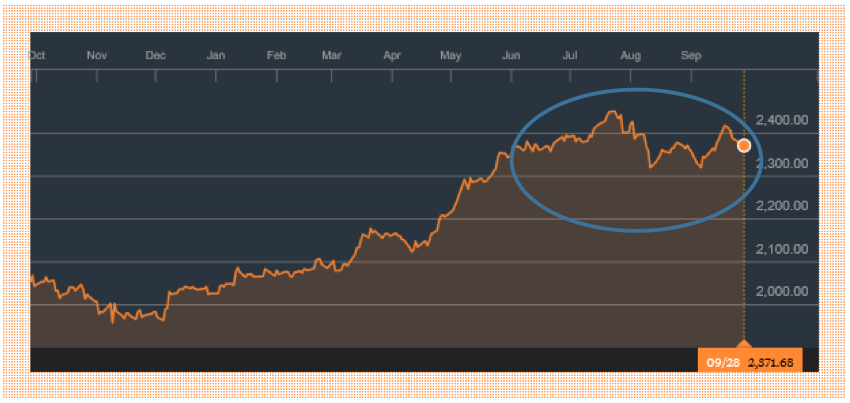
Figure 1. South Korea’s KOSPI Index over 12 months
Source: Bloomberg
Financial markets tend to see through the noise and take their direction most often from movements in interest rates and ultimately company earnings. Over the past few months, there has been a significant tipping point in the global interest rate environment which bears some examination. Ten years after the onset of the GFC, markets are finally seeing the end in sight for emergency interest rates and quantitative easing. However the transition from ultra-low rates to “normality” may take years and will likely see volatility, uncertainty, and the transition will be in fits and starts.
The Federal Reserve gets ready to pull the trigger
The Fed has raised its benchmark rate twice in 2017, to a range between 1% and 1.25%. Investors expect the Fed to raise the benchmark rate for a third time at its final meeting of the year in December. The Fed has kept rates at “emergency levels” for years to encourage borrowing and risk-taking; but it is determined to commence the “normalisation process” and gradually raise rates to reduce stimulus as the economy recovers.
Janet Yellen, the Federal Reserve chair, said last Tuesday that the Fed plans to keep raising its benchmark interest rate despite a lack of inflation. “It would be imprudent to keep monetary policy on hold until inflation is back to 2%,” she said, adding that the Fed “should also be wary of moving too gradually.”
Fed members are monitoring progress on their 2% inflation goal, which they have mostly missed for the past five years. The Fed’s quarterly forecasts released last week show most members projecting one additional rate hike late this year and three more in 2018.
Inflation has stayed stubbornly lower than the Fed has wanted for the past eight years, and it has been falling in the last few months. Yellen is betting that falling prices are a temporary factor and that standard economic theory will assert itself. The Fed has a “dual mandate” - to achieve maximum employment and stable prices. Yellen has emphasized that the job market looks healthy - increasing competition for workers is driving up wages, and inflation is likely to follow. The unemployment rate was 4.4% in August, and the Fed expects it to keep falling toward 4%, the lowest level since 2000.
However, despite strong labour markets, inflation readings have remained low. Not only are key inflation measures below the Fed’s 2% target, but many of them are falling. The most recent headline reading of the inflation rate is 1.9%. But underlying rates, stripping out volatile components, have consistently undershot this figure.
It would seem that the jobs side of the Fed’s mandate offers Yellen a green light to raise rates to keep the economy from overheating, while the inflation side would seem to offer instead a yellow light, and arguably a red one.
They say that setting monetary policy is like driving a car looking in the rearview mirror. When Federal Reserve officials set interest rate policy, they look at how the economy has performed in the past and feed information into models to make decisions that will not show their effects until months into the future.
At present, money market traders and investors see a 70% probability of a rate hike at the Fed’s December meeting. This will not likely dampen enthusiasm for shares on Wall Street. With the Fed’s commitment to a gradualist approach to withdrawing monetary stimulus, slowly rising rates coupled with a healthy and growing economy may provide just the right backdrop for share markets. But who knows as the markets transition from “Quantitative Easing” to “Quantitative Tightening”: there are no guarantees in this business.
Trump’s tax proposals get an airing
President Trump’s key focus in the next few months (when he’s not picking fights with footballers “dissing” the Star-Spangled Banner) will be on tax reform. US markets last Wednesday became more optimistic that a tax deal might get done after President Trump introduced a 9-page plan, the most detailed blueprint yet. Most importantly, Trump seeks to slash the US corporate tax rate from 35% to 20% and simplify the enormously complex tax code.
The key proposals are as follows:
Business measures: Corporate tax rate cut to 20% from 35%
Taxation of companies’ non-US earnings scaled back
Individual measures: 7 existing tax brackets collapsed to 3: 12%, 25%, 35%
Elimination of deductions for state and local taxes
Repeal of estate or “death” tax
Standard tax deduction doubled to $12,000 for singles
One-off levy on accumulated offshore earnings
Top tax rate of 25% for partnerships and many small businesses.
The proposals come in a “framework” for tax reform that Trump unveiled as Republicans seek to secure at least one big legislative victory since he took office. President Trump said “Our country and our economy can’t take off as they should unless we dramatically reform America’s outdated, complex and burdensome tax code… It’s a relic. We’ve got to change it. Have to compete with other countries.” Companies typically pay an effective rate below the headline rate. But the broad proposal leaves many difficult policy questions unanswered.
The average top corporate tax rate worldwide is 22.5%. Australia is right up there at 30%.
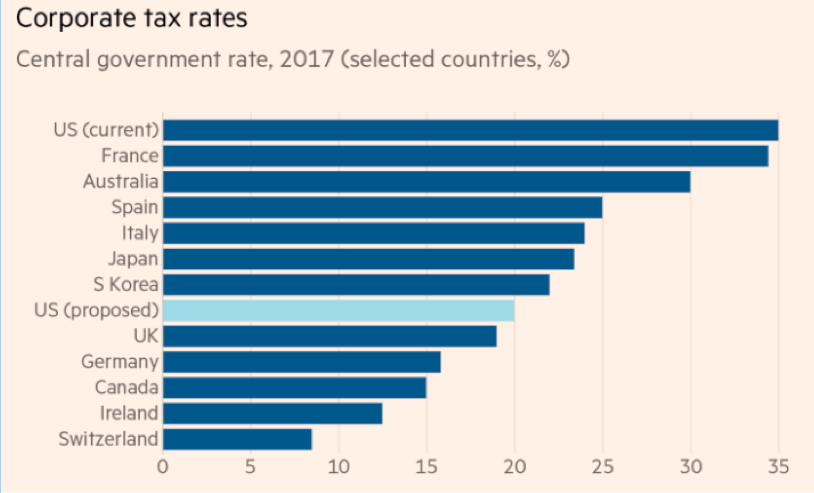
Figure 2. Corporate Tax Rates
Source. OECD, FT
Trump wants the plan to serve as the foundation for the biggest overhaul of the tax code in a generation, boosting business growth and helping middle-class Americans without giving the wealthy a tax cut.
The nine-page framework is more extensive than a one-page White House tax proposal that was ridiculed in April, but its components are at this stage simply aspirations and it is far from being legislation on which lawmakers could vote. For example, the plan reduces seven existing income tax rates for individuals to three, but doesn’t stipulate what income brackets the rate would apply to.
Administration officials said they would leave Congress’s tax writers the option of adding a fourth top rate for the wealthy to ensure the rich did not benefit disproportionally. Officials said they could not say with confidence whether the tax cuts would be fully paid for or would increase the US budget deficit, because it was “up to Congress to set fiscal parameters” in the weeks ahead. For companies, the average top corporate tax rate worldwide is 22.5%. The proposed new US rate would come in below France’s 34%, Australia’s 30%, and Japan’s 23%.
In a move long called for by companies, the Trump administration said the US would move to a “territorial” system under which US companies would in future mainly pay tax only on US earnings, replacing the broad taxation of all worldwide income. Most developed countries tax only their companies’ domestic earnings, but this approach can create incentives for companies to shift profits to low tax jurisdictions. Trump said, “We have embraced the new model. It’s called the American model. Under the American model, we are reducing burdens on our businesses as long as they do business in our country.” But don’t hold your breath waiting for these proposals to be enacted. There is still a long, long way to go in this particular drama.
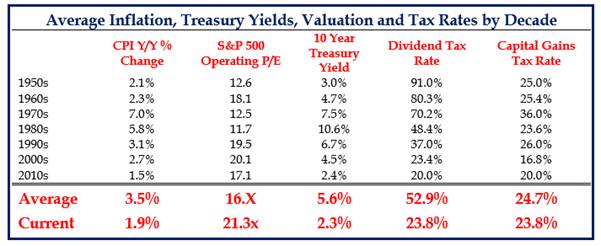
Figure 3. US inflation, bond yields, PE ratios and tax rates from 1950 to present
Source. Strategas Quarterly Review, 2 Oct 2017
The case for a bottom in the $US, and a top in the A$
The prospect of higher US interest rates – and President Trump’s tax proposals – suggests the long slide in the $US may be drawing to a close. The decline has reflected several factors. For starters, being bullish on the $US was a “crowded trade” earlier this year. Disappointment that Trump could not bring forth tax cuts quickly enough was another negative factor, as was the drop in US inflation – which led markets to reduce the probability of higher official from the Fed.
As discussed earlier, the Fed has indicated its intent to raise rates in December and announced it will start gradual balance sheet reduction from next month. The expectation among voting Fed members is that rates would rise a further three times in 2018 – but take that with a pinch of salt, as they have been consistently wrong for years now. Whether right or not, eventually market interest rates will need to adjust, which will presumably help push up the $US.
As regards the AUD, there are other negative factors at play. Iron ore prices have started to weaken, reflecting ongoing growth in global supply and Chinese plans to curb steel production due to pollution concerns. China’s sovereign credit rating downgrades over recent months – due to rising corporate debt – highlights the need for China to tackle debt-fuelled industrial overcapacity, probably once the 5-yearly leadership transition takes place later this month and Xi Jinping is re-elected. The interest rate differential between Aussie Bonds and US Treasuries is shrinking, making Australian Bonds less attractive: at present, Australian 10 year bonds yield 50 basis points higher than 10 year Treasuries, but as the Fed tightens, this differential will likely shrink. The last time the yield differential approached zero (it fell to 0.15% in March 2001), the AUD fell below US$0.50. Of course, many other factors were in play, and this is certainly not a forecast.
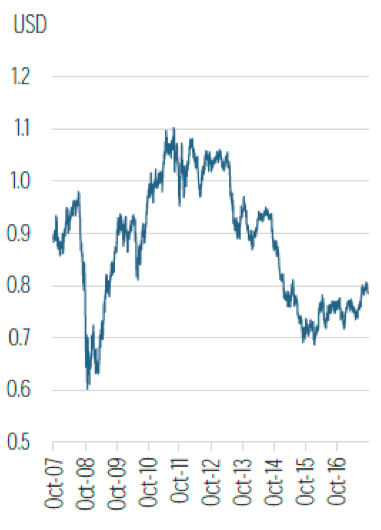
Figure 4. AUD vs USD over last 10 years
Source. Bloomberg, UBS
It is interesting to note the slide in the A$ over recent days coincided with the Turnbull government discussions to reserve LNG for domestic consumption: a reduction in volumes of our third largest export commodity (after iron ore and coal) would weaken the trade balance and thus reduce international investor interest in the Australian economy and the A$. Weaker iron-ore, copper and gold prices and an RBA disinclined to raise rates for the foreseeable future are all negatives for the AUD.
As seen in the RBA’s Index of Commodity Prices, it appears that the broader uptrend in prices from early 2016 (iron ore, coal, copper) is now starting to unwind.
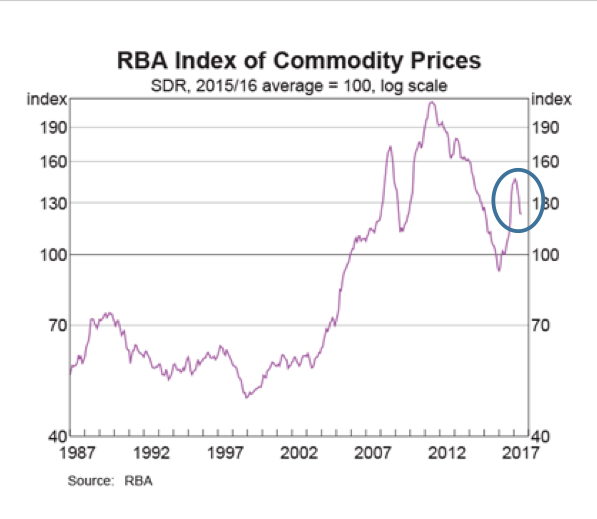
Figure 5. RBA Index of Commodity Prices
Source. RBA
While the Reserve Bank has talked up prospects for the Australian economy of late – and publicly agreed with the view that local interest rates have likely bottomed – it still suggests the eventual move higher in local interest rates is some way off. On the contrary, with home building activity weakening, retail spending anaemic, wages growth largely absent and confidence waning, there is every chance that GDP growth will fall short of the RBA’s expectations of 3%. That translates into inflation remaining subdued, and rate increases off the table. No doubt the RBA would be more inclined to raise rates with the AUD at US$0.72 or UD$0.74, rather than at US$0.80.
LNG stuff up
Despite being one of the world’s biggest liquefied natural gas producers, Australia is likely to face a major domestic gas supply shortfall in 2018. Although $200bn has been invested in the LNG sector over past decades, Australia will have a deficit of up to 55 petajoules next year unless LNG producers redirect sales from the international spot market to the domestic market on Australia’s east coast. Following a series of power outages and a rise in electricity and gas prices, the government in April directed the ACCC to conduct a broad inquiry into the market, with reports due every six months ahead of a final report in 2020. The ACCC has warned in an interim report on its inquiry into the gas market that “More than one-third of commercial and industrial users spoken to by the regulator are considering reduced production or closure due to high gas prices”. The deficit could be as high as 108 petajoules if demand is higher than forecast, ACCC Chair Rod Sims added. “It is unclear why we are not seeing more steps being taken by the LNG projects to supply more gas to the domestic market. Although we accept some additional coordination costs would be likely and agreement of the joint venture parties of the LNG projects is required.”
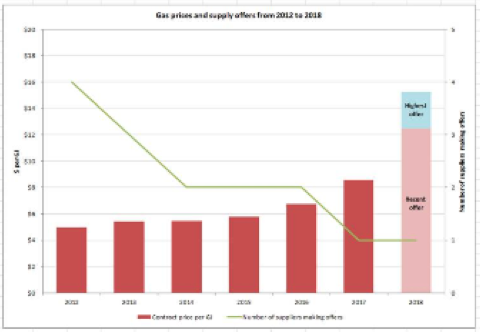
Figure 6. Australian gas prices and supply offers – 2012 to 2018
Source. ACCC
The ACCC says the government’s export controls – which allow for the restriction of international LNG exports and have caused alarm in the resource sector – need to be coupled with measures to allow more suppliers into the domestic market.
NBN – case study in failure?
Australia is one of the richest countries in the world but it ranks only 50th when it comes to average broadband speeds, behind the US and most of its European and Asian competitors, according to a report by Akamai, a content delivery company. The rollout of the NBN - which will theoretically connect all 12m homes and businesses to superfast broadband - was intended to transform Australia into the most connected continent on the planet. It was an important part of Labor’s platform and a factor in Kevin Rudd’s election victory in November 2007 over John Howard. It became a contentious issue once again in the 2013 Federal Election.
Kevin Rudd on the NBN:
“The NBN will bring about another education revolution in regional areas with access to content and resources for eLearning. It will also transform the way our schools interact with their students, their families, nearby schools and schools on the other side of the world. The NBN will make the government’s investments in tele-health and personally controlled electronic health records pay real dividends in improved patient outcomes.”
But in the words of the Financial Times, “with the network now covering half the country, take-up is slow, speeds are below expectations, prices are high and customer frustration is rising with complaints doubling in the six months to the end of December. Some business leaders warn Australia’s biggest infrastructure project … has become an object lesson in how not to pursue a nation-building plan, citing political interference, poor technology choices and inadequate delivery.”
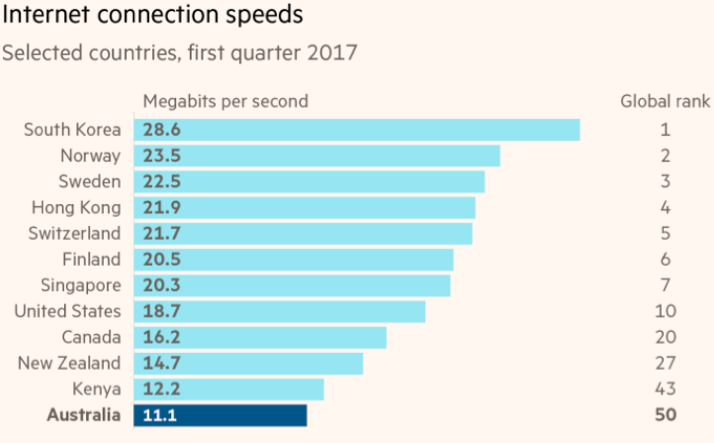
Figure 7. Internet connection speeds
Source. Akamai, State of the Internet Report, FT
The NBN remains a political hot potato, with risks for PM Malcolm Turnbull, who criticised the original strategy to connect every home to a fibre network due to high costs. Instead, he backed a proposal to use a mix of fibre and householders’ existing copper network - a cheaper upfront option but one that critics claim will require expensive upgrades later. “The way we’re heading now whoever is in office in 2020 will have to deal with our biggest ever national infrastructure debacle,” said Laurie Patton, executive director of Internet Australia, an industry group.
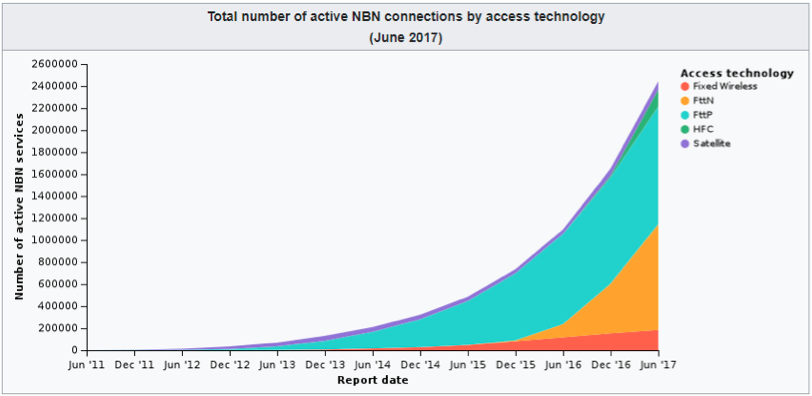
Figure 8. Total number of active NBN connections by access technology (June 2017)
Source. NBN
In 2009, the Rudd Labor government established the NBN to build a fibre network providing speeds of 100 megabits per second to 90% of homes and businesses by 2017, at a cost of A$43bn. The project consistently experienced delays and when the Liberal-National coalition was elected in 2013, Malcolm Turnbull ordered a review that forecast costs rising to A$72.6bn. He backed a cheaper “fibre to the node” plan that involves laying fibre to street level boxes, where it connects to the final kilometre of copper wire that runs into homes. The government costed the plan at A$41bn, although it has since risen to A$49bn.
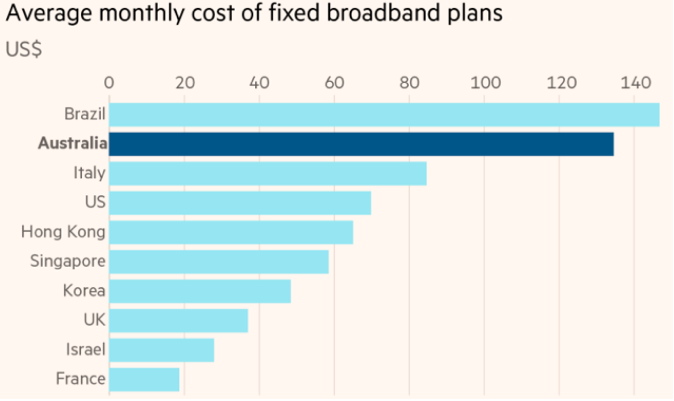
Figure 9. Average monthly cost of fixed broadband plans
Source. Federal Communications Commission, FT. Figures in US$ and calculated at purchasing power parity.
The NBN rejects this critique, saying Australia’s size, its low density of homes and the cost structure of the network it leases from Telstra, increases its costs. It promises speeds will improve and nearly half of homes will eventually be able to connect to one gigabit per second services. “I don’t think we will lag anyone,” said Bill Morrow, NBN chief executive. He blames problems related to slow speeds on the retail service providers, who are not buying enough bandwidth from the NBN to ensure faster speeds. However, retailers say the NBN charges too much for bandwidth, as it recoups the cash lent to it by the state.
Under the NBN model, if it misses its financial targets, taxpayers are on the hook, which has made it loath to reduce charges. But critics warn unless prices fall and services improve customers could lose faith in the network, which could also cause NBN to miss its targets. The government recently ordered a review into the NBN but there seems little appetite for a radical change of policy. Like electricity pricing and the LNG export imbroglio, there is probably more than enough blame to heap upon both sides of the political divide; in the meanwhile, quoting the FT, “for some customers, waiting for a fast connection has become interminable.”
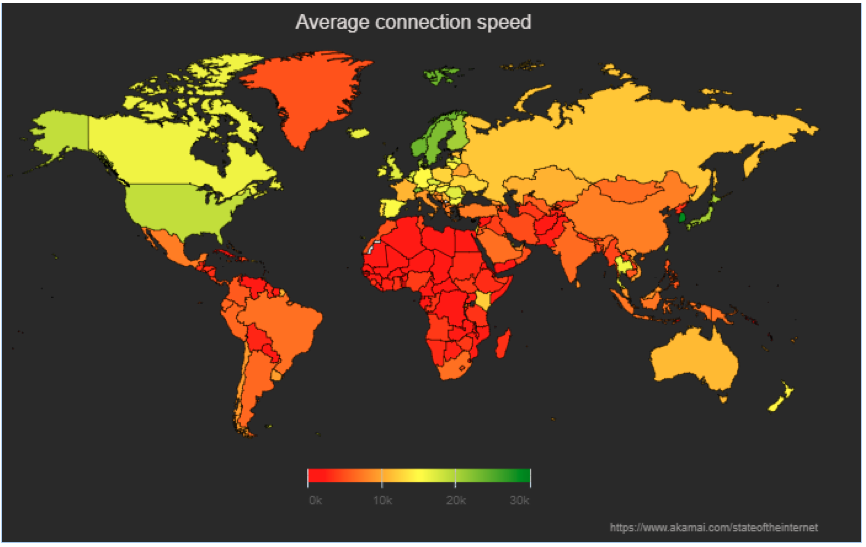
Figure 10. Global connection speeds – Australia needs to be a lot greener
Source. (VIEW LINK) State of the Internet Report 2017
Is bitcoin in “bubble” territory?
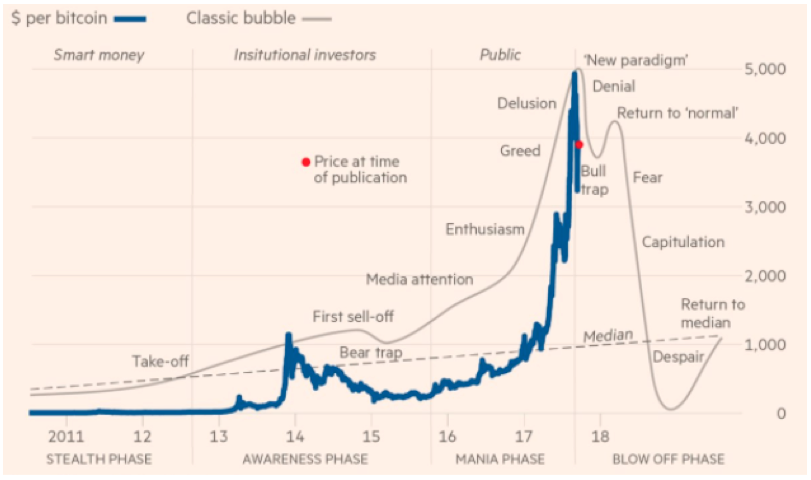
Source. Thompson Reuters, FT
Never miss an update
Enjoy this wire? Hit the ‘like’ button to let us know.
Stay up to date with my current content by
following me below and you’ll be notified every time I post a wire
The Clime Group is a respected and independent Australian Financial Services Company, which seeks to deliver excellent service and strong risk-adjusted total returns, closely aligned with the objectives of our clients.

4 topics
1 stock mentioned
Clime Investment Management
Funds Management & Stock Research
Clime Investment Management
The Clime Group is a respected and independent Australian Financial Services Company, which seeks to deliver excellent service and strong risk-adjusted total returns, closely aligned with the objectives of our clients.
Expertise
Clime Investment Management
Funds Management & Stock Research
Clime Investment Management
The Clime Group is a respected and independent Australian Financial Services Company, which seeks to deliver excellent service and strong risk-adjusted total returns, closely aligned with the objectives of our clients.
Expertise
Comments
Comments
Sign In or Join Free to comment