Yield curve inversion – what it means

Scott Shuttleworth
Vega Capital
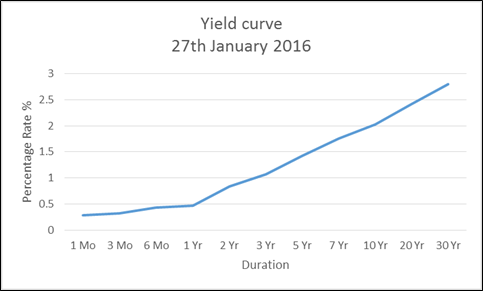
Let’s start by reviewing what the yield curve actually is. Consider a range of durations for government notes, for example, you can have 3-month notes, 1-year notes, 2-year notes and so on up to 30-year bonds and notes.
The normal course for debt instruments is that as the duration increases, so does the yield (i.e. how much interest you earn). Think of it a bit like term deposits at any of our major banks – you typically get a higher rate for holding your money in a longer dated term deposit. The same rule applies normally to bonds and notes.
Hence as a function of yield rate and maturity, we usually see an upward sloping curve like this.
However, let’s say that investors take the view the interest rates will fall materially over the coming years. It makes sense that this won’t impact near term yields much (since they’ll pay before much rate cutting is done), but medium/longer-term yields will need to fall. Thus the curve exhibits an inverted shape.
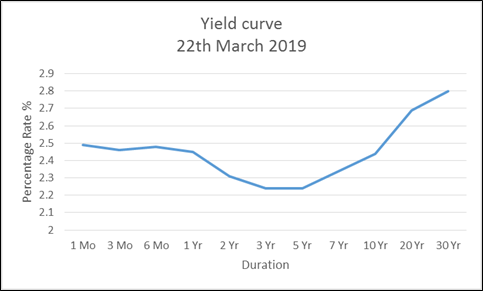
So there we have it – that’s yield curve inversion. Pretty simple!
Implication
Many investors believe that an inverted yield curve is a precursor to a recession. This conclusion isn’t without merit as we can see from the below chart. All the below recessions were preceded by a yield curve inversion (where the 10-year rate was lower than the 1-year rate).
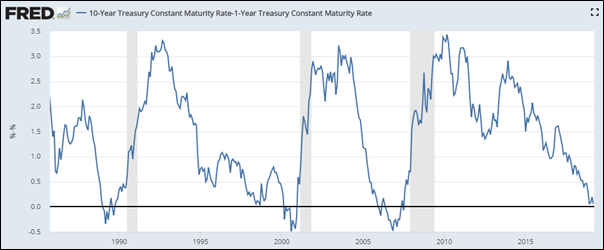
Notice the time differential between the curve inverting and a recession actually starting - it can be anywhere between 6-30 months. An indicator with such a wide lag isn’t useful if we’re looking to avoid a recession or go short. For the former case, if we were to remove our long positions, we could miss out on considerable upside. In the latter case, if we do short, our downside exposure (should stocks rally rather than fall) could be large.
Further, it’s difficult to suggest as to why an inverted curve would cause a recession. Afterall, it’s just a reflection that investors are expecting a falling rate in future which should be a positive for business since debt becomes more affordable.
So why does there look to be a link? Yield curve inversions usually occur towards the end of a business cycle (where we would expect a recession anyway) after the central bank has finished with several rounds of hikes and moved to pause on or reduce future rates.
Late in the cycle, many firms are already highly leveraged and thus sensitive to adverse outcomes. The cut/pause in rates may help on the margin, but often other events overwhelm business prospects (for example, the 'dot com' crash, GFC etc). It's often true that rates are cut to provide a soft landing for said adverse outcomes.
Hence we have a case where there appears to be a correlation but this does not imply causality.
In finance, curve inversion can cause some problems. Many firms in this sector earn a return by issuing short term debt and re-lending it for longer durations at a higher rate. If long term rates fall, then these profit margins can also fall. That said, such problems can be managed.
To sum it up, yield curve inversions have no real ‘magic power’. They’re more a symptom of other issues present in an economy which have been significant enough to reduce future interest rate expectations relative to current levels.
What’s occurring now and what is Vega Capital doing?
As of last Friday (22nd of March 2019), the 1 year US Treasury bill yield traded higher than that of the 10 year US Treasury bill yield, an important inversion level.

As our readers would know, we’ve been cautious about the US economy since early January and continue to worry about it seemingly edging closer and closer to a recession.
We remain long US equity exposure via options and have been progressively lowered our exposure over the past few months as the market continued to rally. This was largely due to the returns on offer in the equity options market not being sufficiently attractive to warrant a more substantial position.
An inversion in the yield curve is not sufficient evidence for us to take a bearish view of the market. As noted prior, there can be a large gap between the time at which inversion occurs and the eventual recession. Shorting during this long time frame can result in very large portfolio drawdowns which we don’t wish to endure. Further, there are better sources of data which flag recession risks with a much shorter lag.
Our algorithms which monitor the US economy would need to see a larger interruption to the ability of businesses and consumers to utilise debt before any short positioning could be considered.
That said, we could be short in a month or in more than a year depending on the data. At this stage, it’s hard to know.
Never miss an update
Enjoy this wire? Hit the ‘like’ button to let us know.
Stay up to date with my current content by
following me below and you’ll be notified every time I post a wire
Scott has seven years of experience in investment and risk management, was previously an analyst at Montgomery Investment Management, and holds a degree Economics from the UWA as well as a Master’s degree in Financial Mathematics from UNSW.

8 topics
Scott Shuttleworth
Founder and Portfolio Manager
Vega Capital
Scott has seven years of experience in investment and risk management, was previously an analyst at Montgomery Investment Management, and holds a degree Economics from the UWA as well as a Master’s degree in Financial Mathematics from UNSW.
Expertise
Comments
Comments
Sign In or Join Free to comment