Key calls on major markets & stocks for the week ahead
It’s currently very easy to get caught up in the negativity surrounding stocks as a potential Trump-China trade war dominates the press, interestingly something that was not getting any air-time whatsoever 3-months ago nor being touted as a potential ‘threat’ to the market. However let’s stand back and consider what we said at the start of the year when markets were quiet and not influencing our thoughts in any way day to day. From our 2018 Outlook Piece:
“A warning pullback for stocks appears imminent but a decent downturn for stocks may easily be 6 -months away” - This was our first point, word for word, in the January MM Outlook Report.
Of course now its unfolding before our eyes human emotion, the curse of investors and traders alike, makes it easy to panic and think it’s all over for stocks but so far the markets are still following our script – our best guess was the warning drop would be ~6% which is acceptable. Admittedly our shorter timeframe calls have been chopped around as we expected a rally to fresh highs to commence in March but subscribers should always remember that the day to day gyrations of markets are just noise, it’s only when you stand back and look month to month, and beyond, that more meaningful trends emerge.
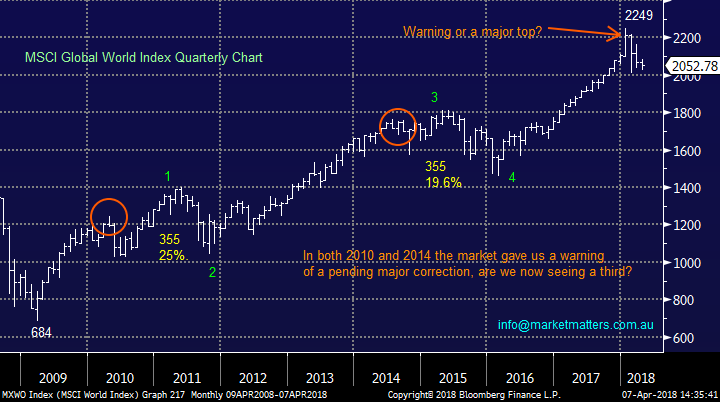
Last week global equities closed -8.8% below their 2018 January high, but down only -2.4% for the calendar year. If our January view is to prove correct markets should hold together over the coming weeks shrugging off Trump-China trade concerns before rallying towards a more important top for stocks.
MM is still forecasting a major correction of around 25% in the medium term hence the risk / reward is still dangerous for the bulls even if we are correct i.e. say +10% upside compared to another ~17% downside – this clearly is the big issue.
MSCI Global World Index Chart
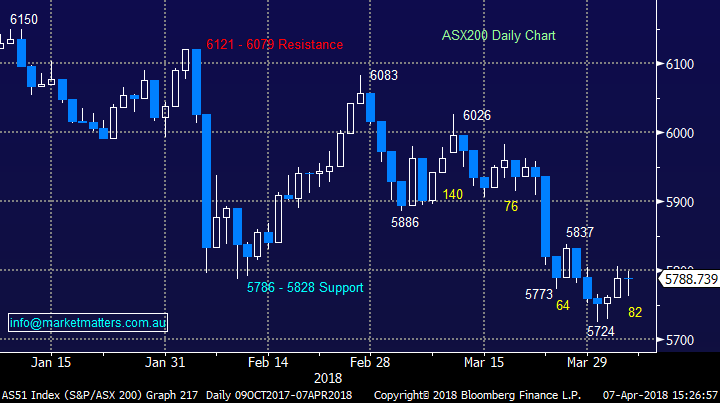
The ASX 200
The market internals have turned and we feel the ASX200 is trying to rally – the below chart illustrates that on the last 4-days of Aprils first week the ASX200 closed near its intra-day high, a bullish sign for the short-term.
We still need the market to close back above 5900 to get excited to the upside in any meaningful manner but from a trading / buying perspective we are not afraid of buying / switching stocks into weakness over the coming weeks. Importantly while we feel weakness can be bought for now it’s certainly does not mean we are buyers of strength!
ASX200 Chart
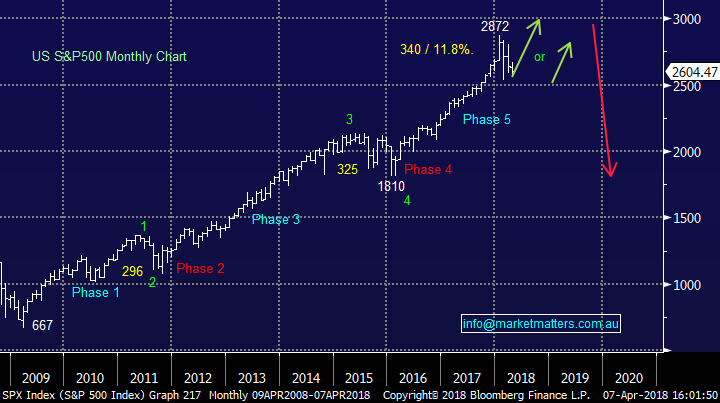
S&P 500
Our view moving into Q2 is unchanged, we are looking for US stocks to find a low fairly soon before attempting a rally to fresh all-time highs – we are now 50-50 whether they can break above Januarys top, now 10% away.
US S&P500 Chart
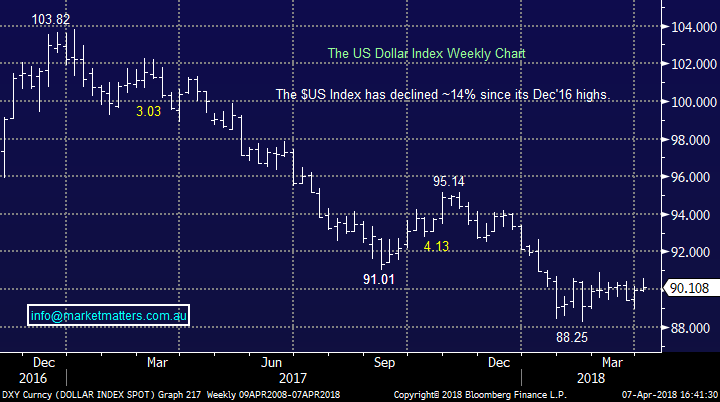
The US Dollar
In January one of our standout contrarian views was the $US would continue its decline before finding a major low around the 88 level. So far this has unfolded perfectly with the $US declining 14% from its late 2016 high.
We believe the $US is either close to / or has made a significant low, hence we are bullish the $US
On Friday MM allocated 3% of our Platinum Portfolio into the $US using the BetaShares ETF (USD) we intend to add an additional 2% if the $US Index spikes down below the 88 support area.
$US Index Chart
Resources
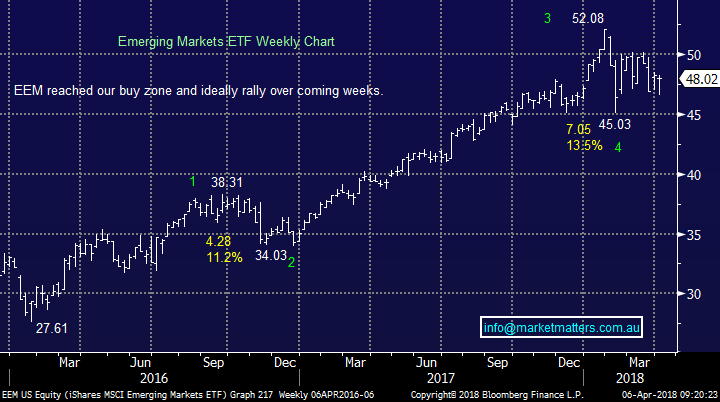
The question is simple - should we be buying this aggressive sell off in resources / iron ore stocks or looking for areas to sell our holdings? On a sector level we still believe they should rally moving forward with the highly correlated EEM ETF positioned well for a rally to fresh 2018 highs ~12% higher. This also coincides with our short-term bullish outlook for copper and crude oil but iron ore is much harder to call with some stability probably our preferred view – that said, technically we are bearish the $A which does not bode well for iron ore over 2018/19.
Emerging Markets (EEM) Chart
Copper
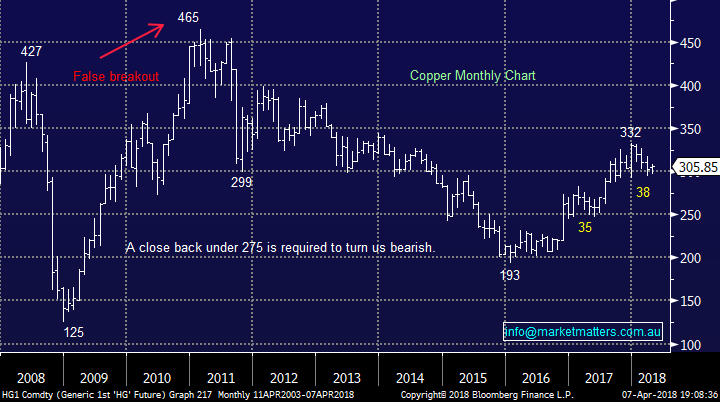
Copper has had a tough 2018 on Friday closing down -7.5% for the year but we actually like copper's technical picture at this justure + there should be good news flow coming from the world Copper Conference in Chile this week.
We are bullish copper targeting 350 with stops beneath 290. As a result we own Oz Minerals (OZL) in the Platinum Portfolio
Copper Chart
Iron Ore
The correction by iron ore was predicted by many economists although it clearly was not built into the respective share prices of the 3 major stocks given their corrections from earlier 2018 highs have been far larger than the overall market:
· BHP Billiton (BHP) -12.5%, Fortescue Metals (FMG) -22.7% and RIO Tinto (RIO) -12.4%.
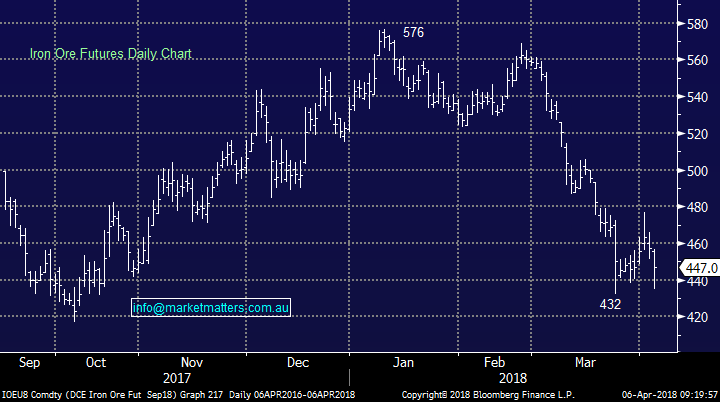
However, when we look at the futures contracts moving forward some stability appears likely on the horizon with the December contract trading at basically the same level as todays spot price. Considering the correlation between iron ore and the ASX200 this implies the local market will at least hold its own on a relative basis for a short-term.
Iron Ore Chart
Crude Oil
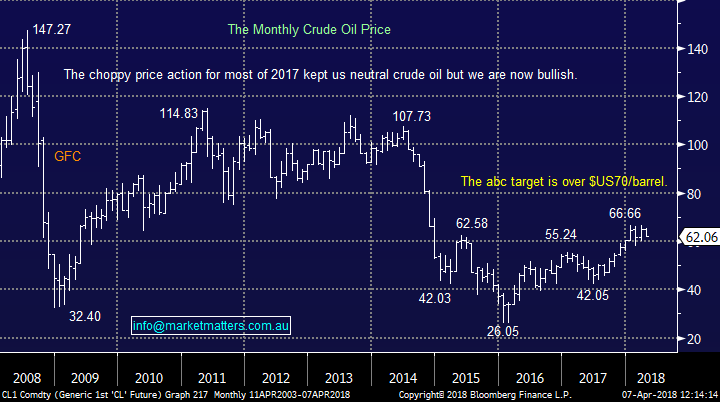
The first 6-months of 2017 were relatively tough for crude oil which at one stage declined over 20% from its 2017 high and 2018 has commenced in similar fashion with a 12.9% decline from Januarys high .
We remain relatively bullish crude oil at current levels with a target around the $US70/barrel level.
Crude Oil Monthly Chart
Aussie Banks feel cheap for now
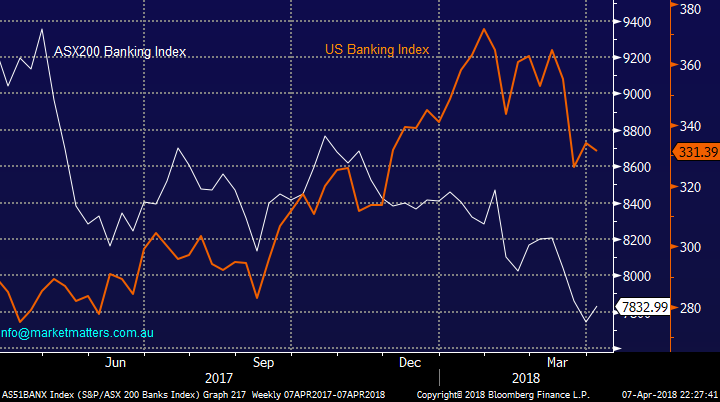
Last week the Australian Banking Sector rallied +0.6% while the US equivalent was down -0.8%, not a dramatic difference until we consider the relative performances since late 2017 – we’ve been smacked on the news flowing from the Royal Banking Commission, rising short term rates plus concerns to the health of our property market moving forward.
While we are not saying sell the family heirlooms and buy banks we can see plenty of support into weakness moving forward unless we see a noticeable downturn in property prices, or upturn in unemployment.
Aussie v US Banking Index Chart
Diversified Financials, the rot to stop?
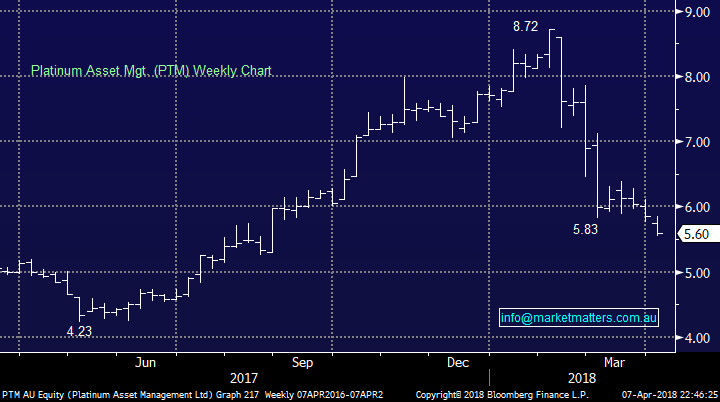
The Financials have experienced an awful time recently but Platinum (PTM) has now reached our trading buy zone having tumbled -24%.
Platinum Asset Mgt. (PTM) $5.60 – Looks an excellent risk / reward trading buy into weakness around $5.50 targeting a 15-20% bounce.
While this is an easy trade not to take due to the departure of Kerr Neilson from PTM it does give us comfort that the sector as whole is at least due for a decent bounce.
Platinum Asset Mgt. (PTM) Chart
Webjet’s (WEB) letting the team down
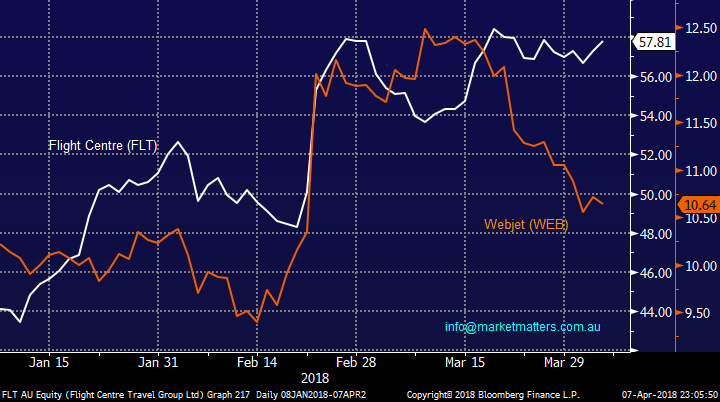
We are long WEB in the MM Platinum Portfolio (up +11.53% at Fridays close) however it’s been a frustrating couple of weeks as its fallen over 10%, while its rival Flight Centre (FLT) has almost made fresh 2018 highs.
The rally by FLT has been aided by the short sellers who have reduced their position to 9.05% still much higher than WEB which was increased slightly to 5.85%.
We remain bullish WEB and expect the gap between the 2 rivals to at least narrow over the coming weeks.
Webjet v Flight Centre Chart
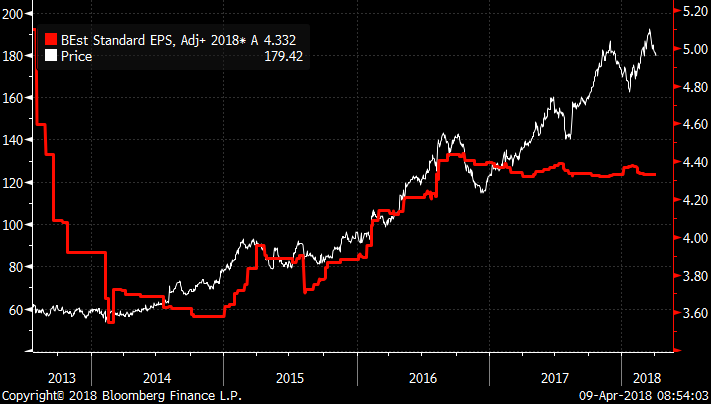
Cochlear (COH) remains bearish technically
While Cohlear has an impressive history of earnings growth the markets current optimism is too high.
We are negative COH targeting ~$160 where we would be a keen buyer.
An excellent company with attractive offshore earnings its 41x valuation makes it easy for us to envisage a pullback to 2018 lows, like the rest of the market.
Cochlear - EPS (Red) v Share Price (White)
Telstra (TLS) is trading at levels not seen since 2011
Everyone certainly hates TLS today but its cheap (10.3x) while paying a 7.1% fully franked yield, the issue is simply around what they will do to plug the earnings gap left by the one off NBN payments.
The stock has more than halved since mid-2015 but it’s had some significant bounces along the way. The 2 largest rallies by TLS of +17.6% and 13% started in April 2016 and April 2017 respectively. Over the last 10-years TLS has rallied on average +6.7% between April and July, historically equity markets weakest time.
With TLS going ex-dividend around March perhaps a large % of the March dividend goes back into the stock. Also of relevance to our thought process is the telco sector generally outperforms in bear / weak markets.
Out on a limb time – we are bullish TLS from ~$3.10.
Telstra (TLS) Chart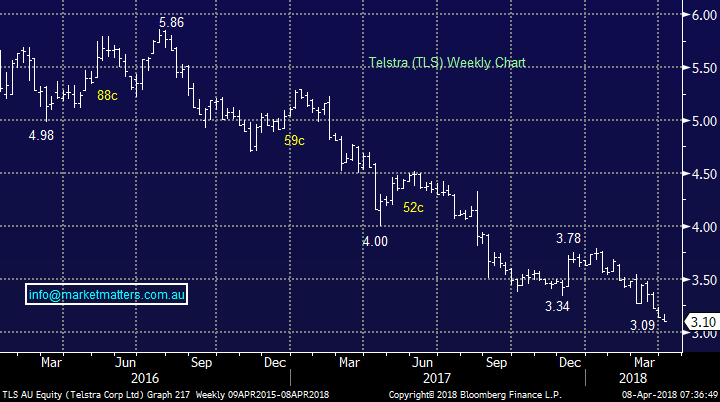
Have a great week
James & the Market Matters Team
This is an extract from the Market Matters Weekend Report. For a free 14 day trial of our full service CLICK HERE
Disclosure
Market Matters may hold stocks mentioned in this report. Subscribers can view a full list of holdings on the website by clicking here. Positions are updated each Friday, or after the session when positions are traded.
Never miss an update
Enjoy this wire? Hit the ‘like’ button to let us know.
Stay up to date with my current content by
following me below and you’ll be notified every time I post a wire
James is the Lead Portfolio Manager & primary author at Market Matters, a digital advice & investment platform with over 2500 members that offers real market intel & portfolios open for investment. He is also a Senior Portfolio Manager at Shaw and Partners heading up a team that manages direct domestic and international equity & fixed-income portfolios for wholesale investors.

4 stocks mentioned

James is the Lead Portfolio Manager & primary author at Market Matters, a digital advice & investment platform with over 2500 members that offers real market intel & portfolios open for investment. He is also a Senior Portfolio Manager at Shaw and...
Expertise
James is the Lead Portfolio Manager & primary author at Market Matters, a digital advice & investment platform with over 2500 members that offers real market intel & portfolios open for investment. He is also a Senior Portfolio Manager at Shaw and...
Expertise
Comments
Comments
Sign In or Join Free to comment
most popular
Equities
High conviction: What we’re backing for the long term
Livewire Markets