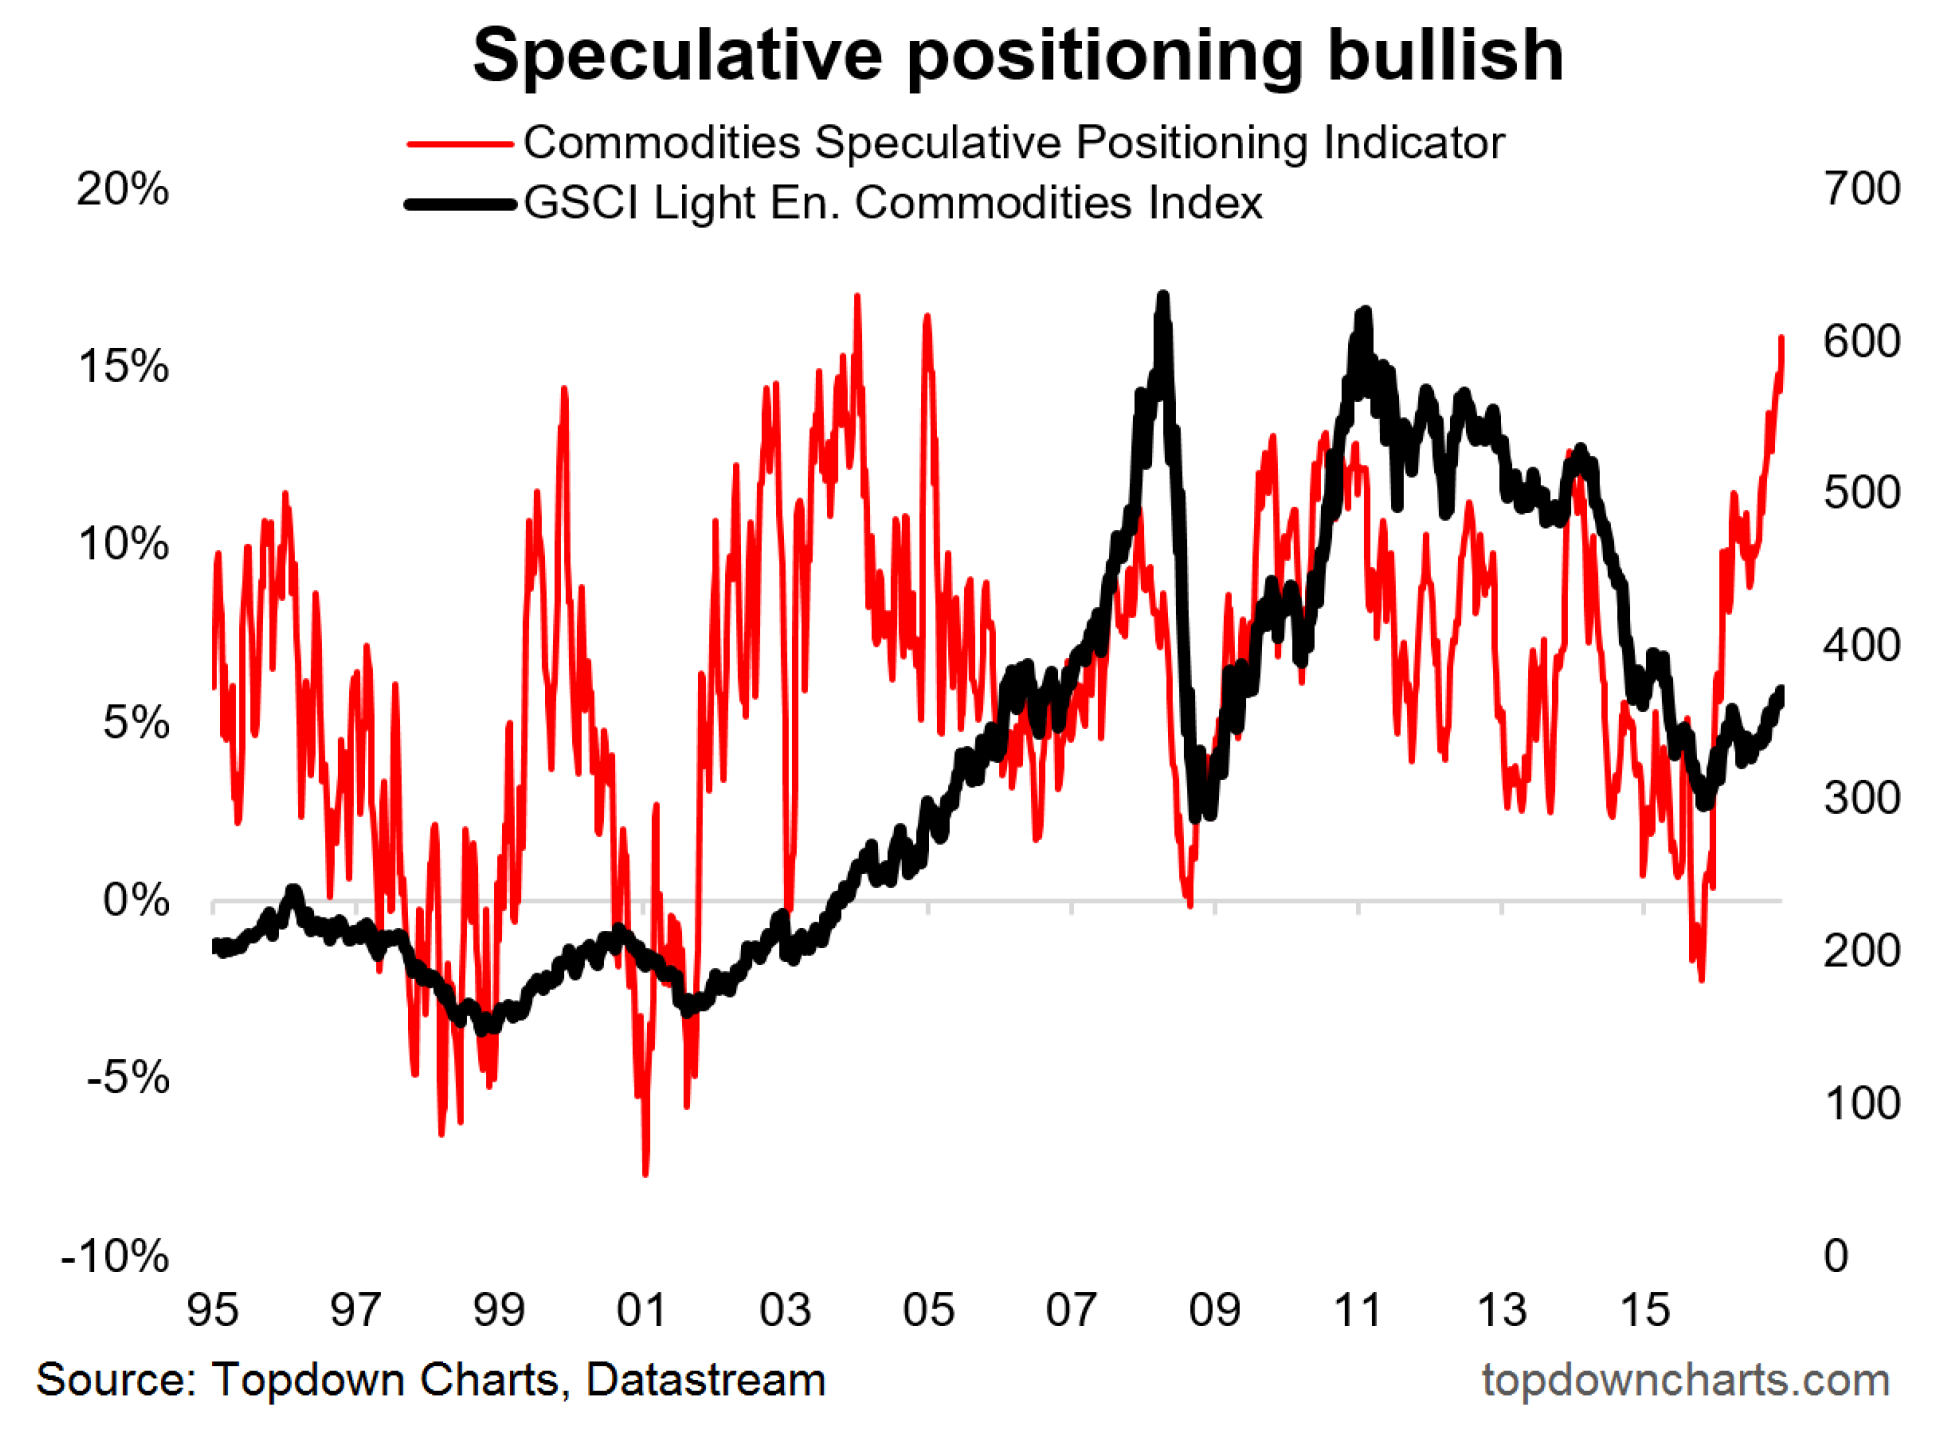
Speculative positioning in Commodities at a 12-year high
The attached chart from the Macro Technicals report shows average speculative futures positioning across commodities against a popular broad commodities index. The bottom line is commodity net-longs are the most stretched they've been in 12 years.
Normally you would consider this to be a contrarian signal, for example, whenever you see a big build-up in either long or short futures positioning it represents extremes in sentiment. If I've learnt anything from studying markets it's that you need to pay attention to extremes, and that often times the dominant emotion or belief at extremes tends to be wrong.
But the exception, and certainly in this case, comes at turning points. In fact, we've seen this kind of pattern before of extreme shorts ... switching around to extreme longs.
Where we've seen it before is at the start of a new bull market in commodities. So it begs the question as to whether this is really a genuine new bull market in commodities...
Never miss an update
Enjoy this wire? Hit the ‘like’ button to let us know.
Stay up to date with my current content by
following me below and you’ll be notified every time I post a wire
Callum is Head of Research at Topdown Charts.
Topdown Charts is a chart-driven macro research house covering global Asset Allocation and Economics.

5 topics

Callum is Head of Research at Topdown Charts. Topdown Charts is a chart-driven macro research house covering global Asset Allocation and Economics.
Expertise
Callum is Head of Research at Topdown Charts. Topdown Charts is a chart-driven macro research house covering global Asset Allocation and Economics.
Expertise
Comments
Comments
Sign In or Join Free to comment