The biggest challenge the world faces today

Phineas Glover
Credit Suisse
Water scarcity, and the societal risks it poses, is one of the primary challenges faced by the world today. Over two billion people still live in countries experiencing high water stress, while four billion people experience severe water scarcity for at least one month a year. Poor water quality exacerbates the issue, with 80% of wastewater globally being returned to the environment untreated, while 4.5 billion people still lack access to safely managed sanitation services. As with any scarce resource, security of supply and related disputes around it threaten to become a rising source of geopolitical tension.
Sources of the problem show no immediate sign of dissipating. With the world’s population set to increase to over ten billion by 2050 from around seven billion today, water demand can potentially increase by more than 70% driven by urbanization and changing consumption patterns in the emerging world. Also, water stress and climate change are inextricably linked with the related disruption in rainfall patterns. The severe bushfires in Australia are a stark reminder, although only one of a series of extreme weather events.
Addressing the consequences of the problem is central to six of the United Nations Sustainability Goals (SDGs). The social and economic benefits are clear, but meeting the aims of the SDGs comes at a cost. The OECD estimates the investment needed to address water scarcity globally at USD 13.6 trillion between 2016 and 2030. Beside governments, private sector capital has to play a more substantial role in developing the necessary infrastructure and new technologies. Accordingly, we consider regulatory and financial frameworks needed to achieve this goal.
Water scarcity: Framing the problem
The great irony surrounding the problem of water scarcity is that water as a resource is widely available, but only a small percentage is readily available for human consumption. With freshwater accounting for less than 1/100th of 1% of the planet’s total water, we note that addressing water scarcity requires improving the efficiency with which we use, and reuse, the total amount of water available, including that supplied by the natural water cycle through precipitation, not least because desalination is too expensive at this point. Water is paradoxically abundant and scarce at the same time.
Figure 1: Excluding inaccessible and saline water leaves only a fraction that is readily available for human consumption

Source: Michael J Pidwirny, Credit Suisse research
According to the United Nations, water use has more than tripled since the 1950s, growing by more than twice the rate of population growth over the last century. Specific targets related to water, sanitation and hygiene have been included as part of the UN Sustainable Development Goals, and while some progress has been achieved on these, much remains to be done. For example, over two billion people still live in countries experiencing high water stress, while four billion people experience severe water scarcity for at least one month a year. Furthermore, only one in three countries with less than 99% of basic water coverage is on track to achieve the required “nearly universal” coverage stipulated by SDG6 by 2030, and only four out of ten people around the world use safely managed sanitation services (40% of people globally do not have basic handwashing facilities at home).
The problem tomorrow
Forecasts from the Organisation for Economic Co-operation and Development (OECD) indicate that water demand will continue to grow at a similar rate as the past 30 years, resulting in an estimated 35.1% increase by 2050. Although agriculture currently represents 69% of global water use, the majority of incremental water demand is expected to come from industry, which includes energy generation, currently at 19% of total water use. Domestic use makes up the balance at 12%.
The likely increase in water demand is set to put the water supply-demand imbalance under even more pressure. In order to alleviate some of this pressure, we believe that consumer behavior will likely need to adapt. The reason for this is that a wide range of consumer products that could see incremental demand from consumers in developing countries as their disposable incomes rise are high in water intensity. For example, producing one ton of beef requires more than 15,000 liters of water, one pair of jeans requires over 7,000 liters of water, while leather boots can require more than 15,000 liters per pair. A growing emerging middle class adopting a “developed consumer approach” would put significant incremental stress on already challenged freshwater availability. This in turn should drive local governments to support policies that adopt a circular economic model.
Investment requirements and solutions
The lack of proper water infrastructure across developing countries requires substantial investment. This is not all, however, as existing infrastructure in developed countries is often old and in need of replacement or upgrading too. For example, the OECD estimates that water leakage across key cities in developed countries can be as high as 37% of total water supply. Estimates for the required amount of investment in global water and sanitation infrastructure vary widely. Reviewing a range of estimates, the OECD believes that USD 13.6 trillion is needed between 2016 and 2030. The World Bank believes that just achieving SDG targets 6.1 and 6.2 alone will require USD 114 billion per year.
We believe that investments in water infrastructure will increase going forward. Our view is not only driven by the need to address infrastructure deficiencies and achieve the targets associated with the relevant SDGs, but also because investing makes sense economically given the multiplier effect of these investments on other sectors and the wider economy.
Water demand: A secular challenge
The challenges related to addressing the rapidly increasing water stress globally are twofold. First, we find that demand for freshwater is showing structural growth. In addition, however, we also see growing challenges related to water supply.
Figure 2: Global freshwater use has consistently outstripped global population
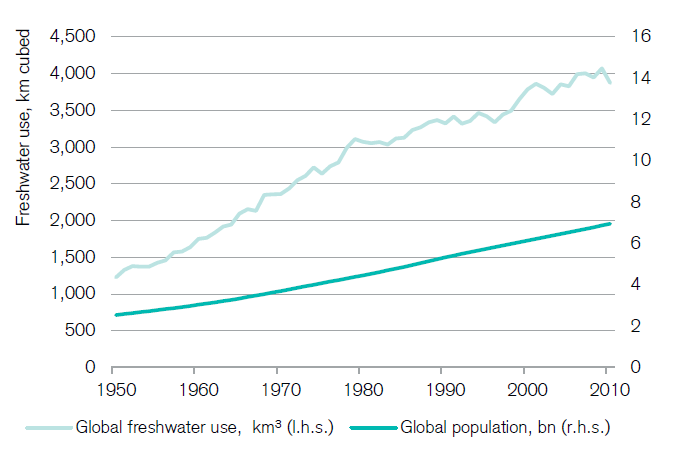
Source: UN, Global International Geosphere-Biosphere Programme, Credit Suisse research
Freshwater use growing in all regions
Since the 1950s, total annual water consumption globally more than tripled from 1.22 trillion m³ to 3.9 trillion m³ in 2011. When broken down by region, we find that water consumption has risen not just across developed markets, but across emerging markets too. The so-called BRIC countries (Brazil, Russia, India, China), for example, account for 43.7% of current global freshwater use, up from a low of 39% in 1956.
Despite the stronger growth seen across emerging markets, we note that water use on a per capita basis across the least-developed countries (e.g. Africa) remains well below that of the developed markets. Water use across North America, in particular, stands out at around 1,200 m³ per capita, which is more than double the global average and roughly 12 times the level seen in Africa.
Water demand by sector
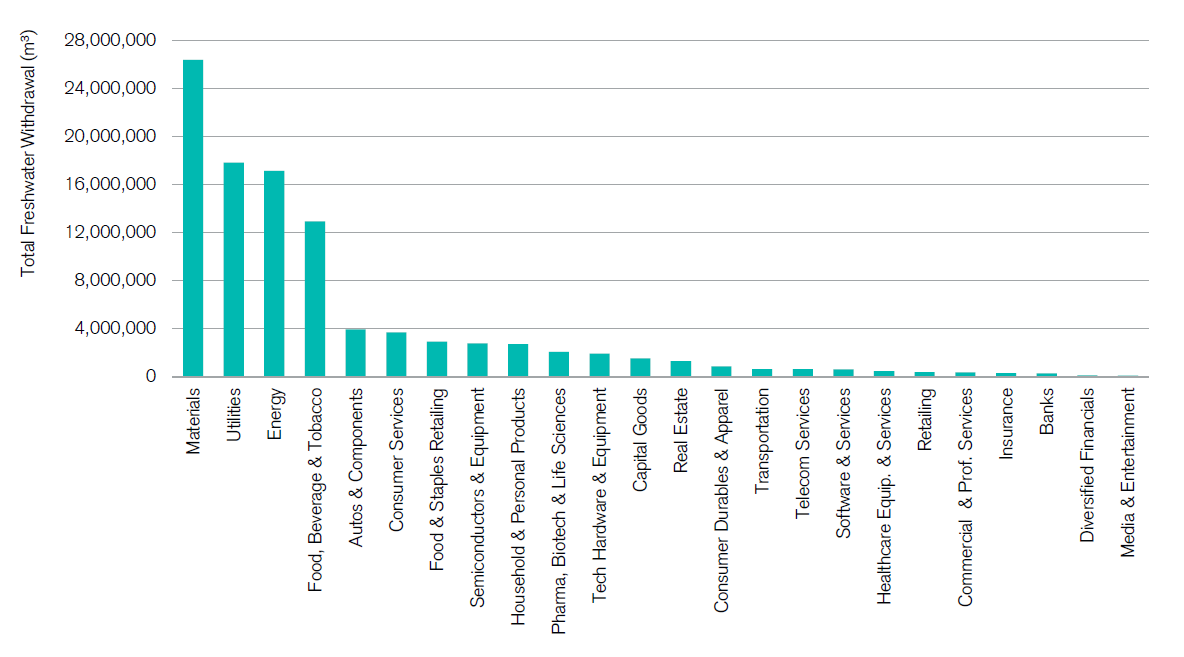
To provide more context around what the impact of a changing economy can be on water intensity, we screened some 20,000 companies across all sectors with regard to their water use. Data availability is an issue, as only 1,269 of the almost 20,000 companies have water withdrawal data for 2018 according to data from market research company Refinitiv.
Although an imperfect exercise given the problem of data deficiency, we calculated total freshwater withdrawal by sector. This shows that an economy with an above-average representation of materials (including metals and mining), energy, utilities, consumer staples and automotive companies is likely to face above-average water challenges too.
Figure 3: Total freshwater withdrawal by sector (m³)
Source: Refinitiv, Credit Suisse estimates
Water supply: A static problem
Having considered the secular trends in water use and consumption, we reconcile our findings with where water resources can be found across the globe. We find that water supply, which we measure using renewable internal freshwater resources, excluding external resources, is typically very static.
The 2030 40% supply-demand gap
One of the most widely cited figures that comes up in the water-scarcity discussion is the 2030 supply-demand gap from the UN-endorsed “Charting Our Water Future” report in 2009. The report notes that incremental water use will largely come from industry in the future, which could see its share of total water use rise from 16% currently to around 22% by 2030.
This scenario assumes stable economic growth and an absence of efficiency gains. Historically, annual efficiency gains in agricultural water use between 1990 and 2004 averaged 1%, with industry following a similar trend. Applying a similar rate of efficiency gains until 2030 helps close 20% of the 40% supply-demand gap, while adjusting for supply growth from technology and cost developments closes another 20%. Despite these potential improvements, there would still be a gap of 24% between supply and demand, suggesting significant water stress on a global scale.
Figure 4: The forecast 2030 supply-demand gap
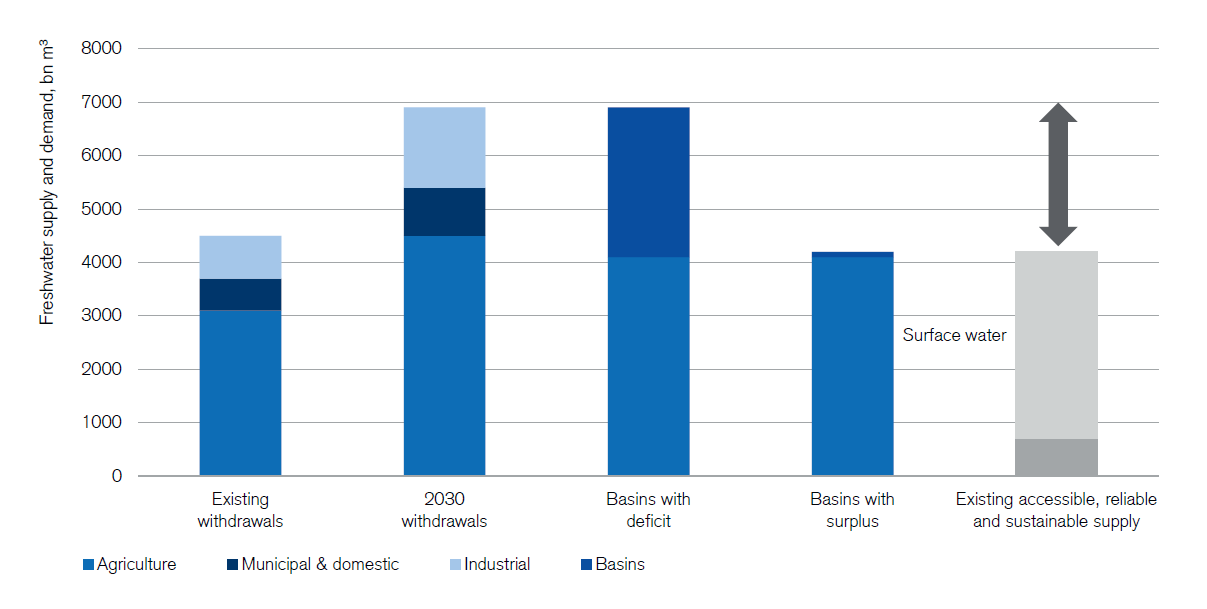
Source: McKinsey, Credit Suisse estimates
The most water-stressed countries today
Given the regional nature of the water-scarcity problem, it is not surprising to find a number of countries facing high levels of stress just north of the equator, as renewable resources are low in these areas given climate and geography. Notably, North Africa and the Middle Eastern countries, along with some Asian countries such as India, are all facing high stress levels.
The most water-stressed countries in 2050
To assess how water scarcity will evolve in the future, we apply a scenario where per capita withdrawals remain constant and apply the UN’s 2050 population forecast for each country, holding renewable resources constant over time. In essence, we assume no investment in water infrastructure is made, as well as an absence of efficiency gains, but also assume no growth in per capita demand from urbanization and economic development. We view this as a conservative consumption given that, globally, per capita withdrawals have fallen from just over 700 m³ in the 1980s to under 600 m³ today.
Table 1: The 20 most water-stressed countries in 2050
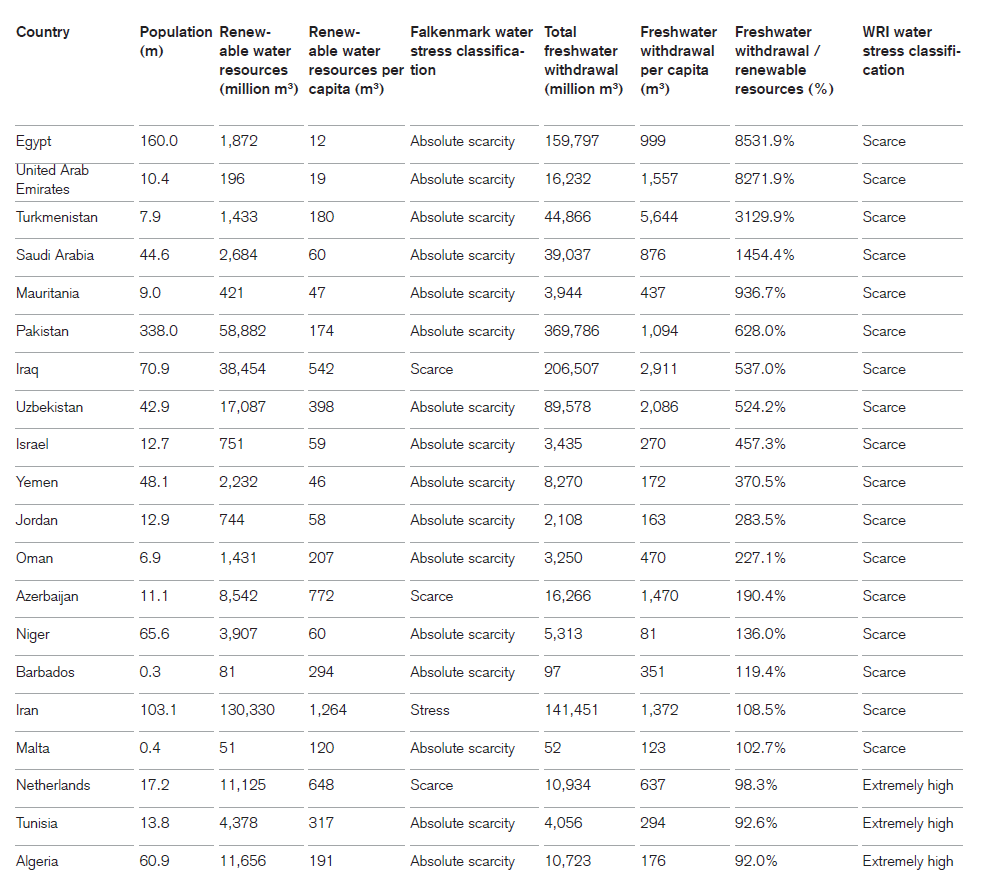
Source: FAO, Aquastat, CIA World Factbook, UN, Credit Suisse estimates
The least water-stressed countries in 2050
Having listed the 20 countries where we believe water stress could be most significant by 2050, we note that, symmetrically, there are countries with surplus water accounts, which we again measure using the criticality ratio where freshwater withdrawals are divided by renewable internal freshwater resources.
Although, simplistically, a lower criticality ratio is usually positive, this is not necessarily always the case as poor accessibility to water may be the reason for a country’s relatively low water withdrawals. For example, the Central Africa Republic appears to be the least-stressed country based on the criticality ratio of 0.1%. However, freshwater withdrawals per capita stand at just 17 m³, clearly suggesting that the low criticality ratio is not because of an abundance of water supply, but more likely because people have poor or no access to available freshwater.
Notably, no countries appear stressed in terms of water according to the Falkenmark metric, which expresses the level of water scarcity in a certain region as the amount of renewable freshwater that is available for each person each year. This suggest that sufficient water supply exists in absolute terms and thereby clearly supports the notion that it is the lack of access that needs to be addressed, which in turn calls for greater investment.
Table 2: The 20 least water-stressed countries in 2050
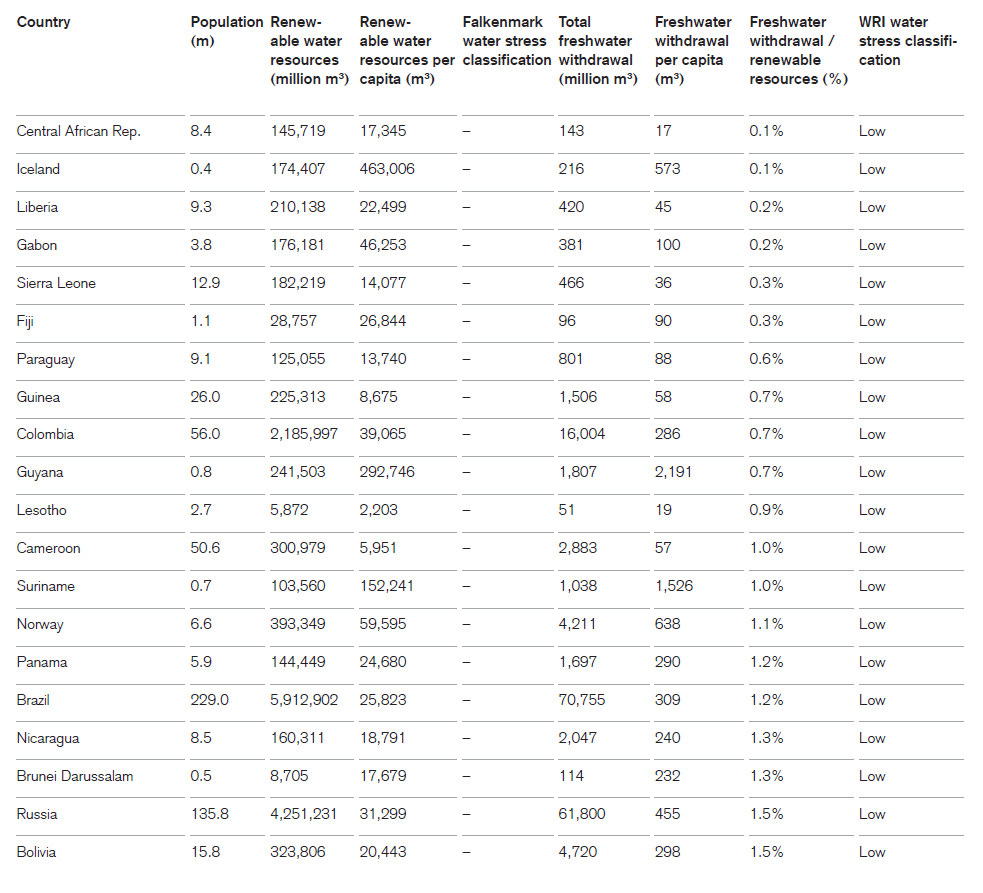
Source: FAO, Aquastat, CIA World Factbook, UN, Credit Suisse estimates
The side-effects of diminished aquifers
Beijing is “sinking”
One side-effect of falling groundwater levels near cities is the gradual lowering of ground levels. Beijing is experiencing precisely this, as some neighborhoods are subsiding at a rate of four inches per year as the aquifer below the city is pumped. Indeed, the North China Plain (the aquifer below the city) has been so heavily extracted to cater to the city’s population of over 20 million that Beijing is now the fifth most stressed city in the world. In 2014, Beijing’s supply per inhabitant stood at just 145 m³, which is classified as “absolute water scarcity” according to the Falkenmark index.
Jakarta
With more than ten million people, Jakarta faces very significant risk from both flooding and groundwater depletion. Recent events that underscore these risks include floods in 2007, which caused more than 300,000 people to be evacuated while 80 citizens died. A Dutch engineering firm (Witteveen and Bos) estimated that the city would need seven-meter high walls to protect itself from rising sea levels. Models from the Bandung Institute of Technology suggest that 95% of the city will be submerged by 2050. This is not only driven by rising sea levels, but also by the fact that the city is sinking quickly. Over the past ten years the city has sunken by 2.5 meters.
Investment requirements and challenges
Water faces a mismatch between the daunting infrastructure investment requirements and the capital costs entailed, with the current ability to price water being significantly constrained and regulated. Estimates of the required investment in global water and sanitation infrastructure by 2030 vary considerably from USD 7.5 trillion (McKinsey 2016) to USD 23.1 trillion (New Climate Economy Report, 2014). An OECD technical note reviewing varying forecasts, estimates a USD 13.6 trillion cumulative investment requirement (2015 USD, 2016–2030).
The need for higher water prices
Data from the World Bank indicates that water investments from the private sector in emerging market infrastructure has averaged just USD 1.6 billion over the past 30 years. By way of contrast, transport investments have averaged USD 14.9 billion, while energy investments have averaged 20.5 billion. Evidently water infrastructure in emerging markets has been heavily underinvested and solely reliant on public finance to drive improvements. To change this trend, clearly the private sector needs incentives to invest.
To fund these projects, there needs to be a shift in the current orthodoxy of pricing. The average price for water and wastewater is USD 2.06 per m3, which falls well short of its true capital cost (source: Global Water Intelligence (GWI)). GWI estimates that water tariffs need to increase by 5.9% every year to achieve the UN SDGs by 2030. These vast but essential sums necessitate a growing role for private sector investment. This will include collaborative public-private partnerships (PPPs), as well as innovative financing arrangements that match capital markets with specific projects through green and blue bonds.
But this funding gap is underpinned by a fundamental imperative. If no efficiency gains are assumed, global water requirements could grow from 4,500 billion m3 today to 6,900 billion m3 in 2030 (2030 Water Resource Group). This is a full 40% above current accessible, reliable supply. This scarcity gap is overwhelmingly concentrated in Asia, where one-third of the population concentrated in developing countries is estimated to live in basins with a deficit larger than 50%.
Pricing: Mismatch between price and capital cost
While water is an essential part of life, consumers pay heavily regulated and subsidized prices, distorting the long-term economics of project finance. Ultimately, the current low pricing in many regions means that the return hurdles on many long-term capital investments are not met. The obvious response to this would be to raise pricing. However, this is challenging on a number of levels, and confronted with trade-offs between the social and environmental dimensions. Therefore, the current orthodoxy has been for water pricing to be subject to a range of limitations due to government regulation and resistance from other stakeholders.
Water externalities yet to be factored in: This price/value mismatch is most evident if the true environmental cost is incorporated. Research by Trucost (for the TEEB for Business Coalition) estimates the unpaid environmental cost of water consumption by global primary production and processing business sectors at USD 1.9 trillion, or around 2.5% of global GDP. Wheat and rice farming in Southern Asia were found to have the greatest water risk due to high irrigation rates in this water-scarce region.
The global average cost of water and wastewater tariffs in Global Water Intelligence’s 2017 survey across 452 cities worldwide was USD 2.06/m3. There was considerable variance, with South Asia remaining the cheapest region for water at just USD 0.14/m3, while Denmark was the most expensive at USD 8.52/m3.
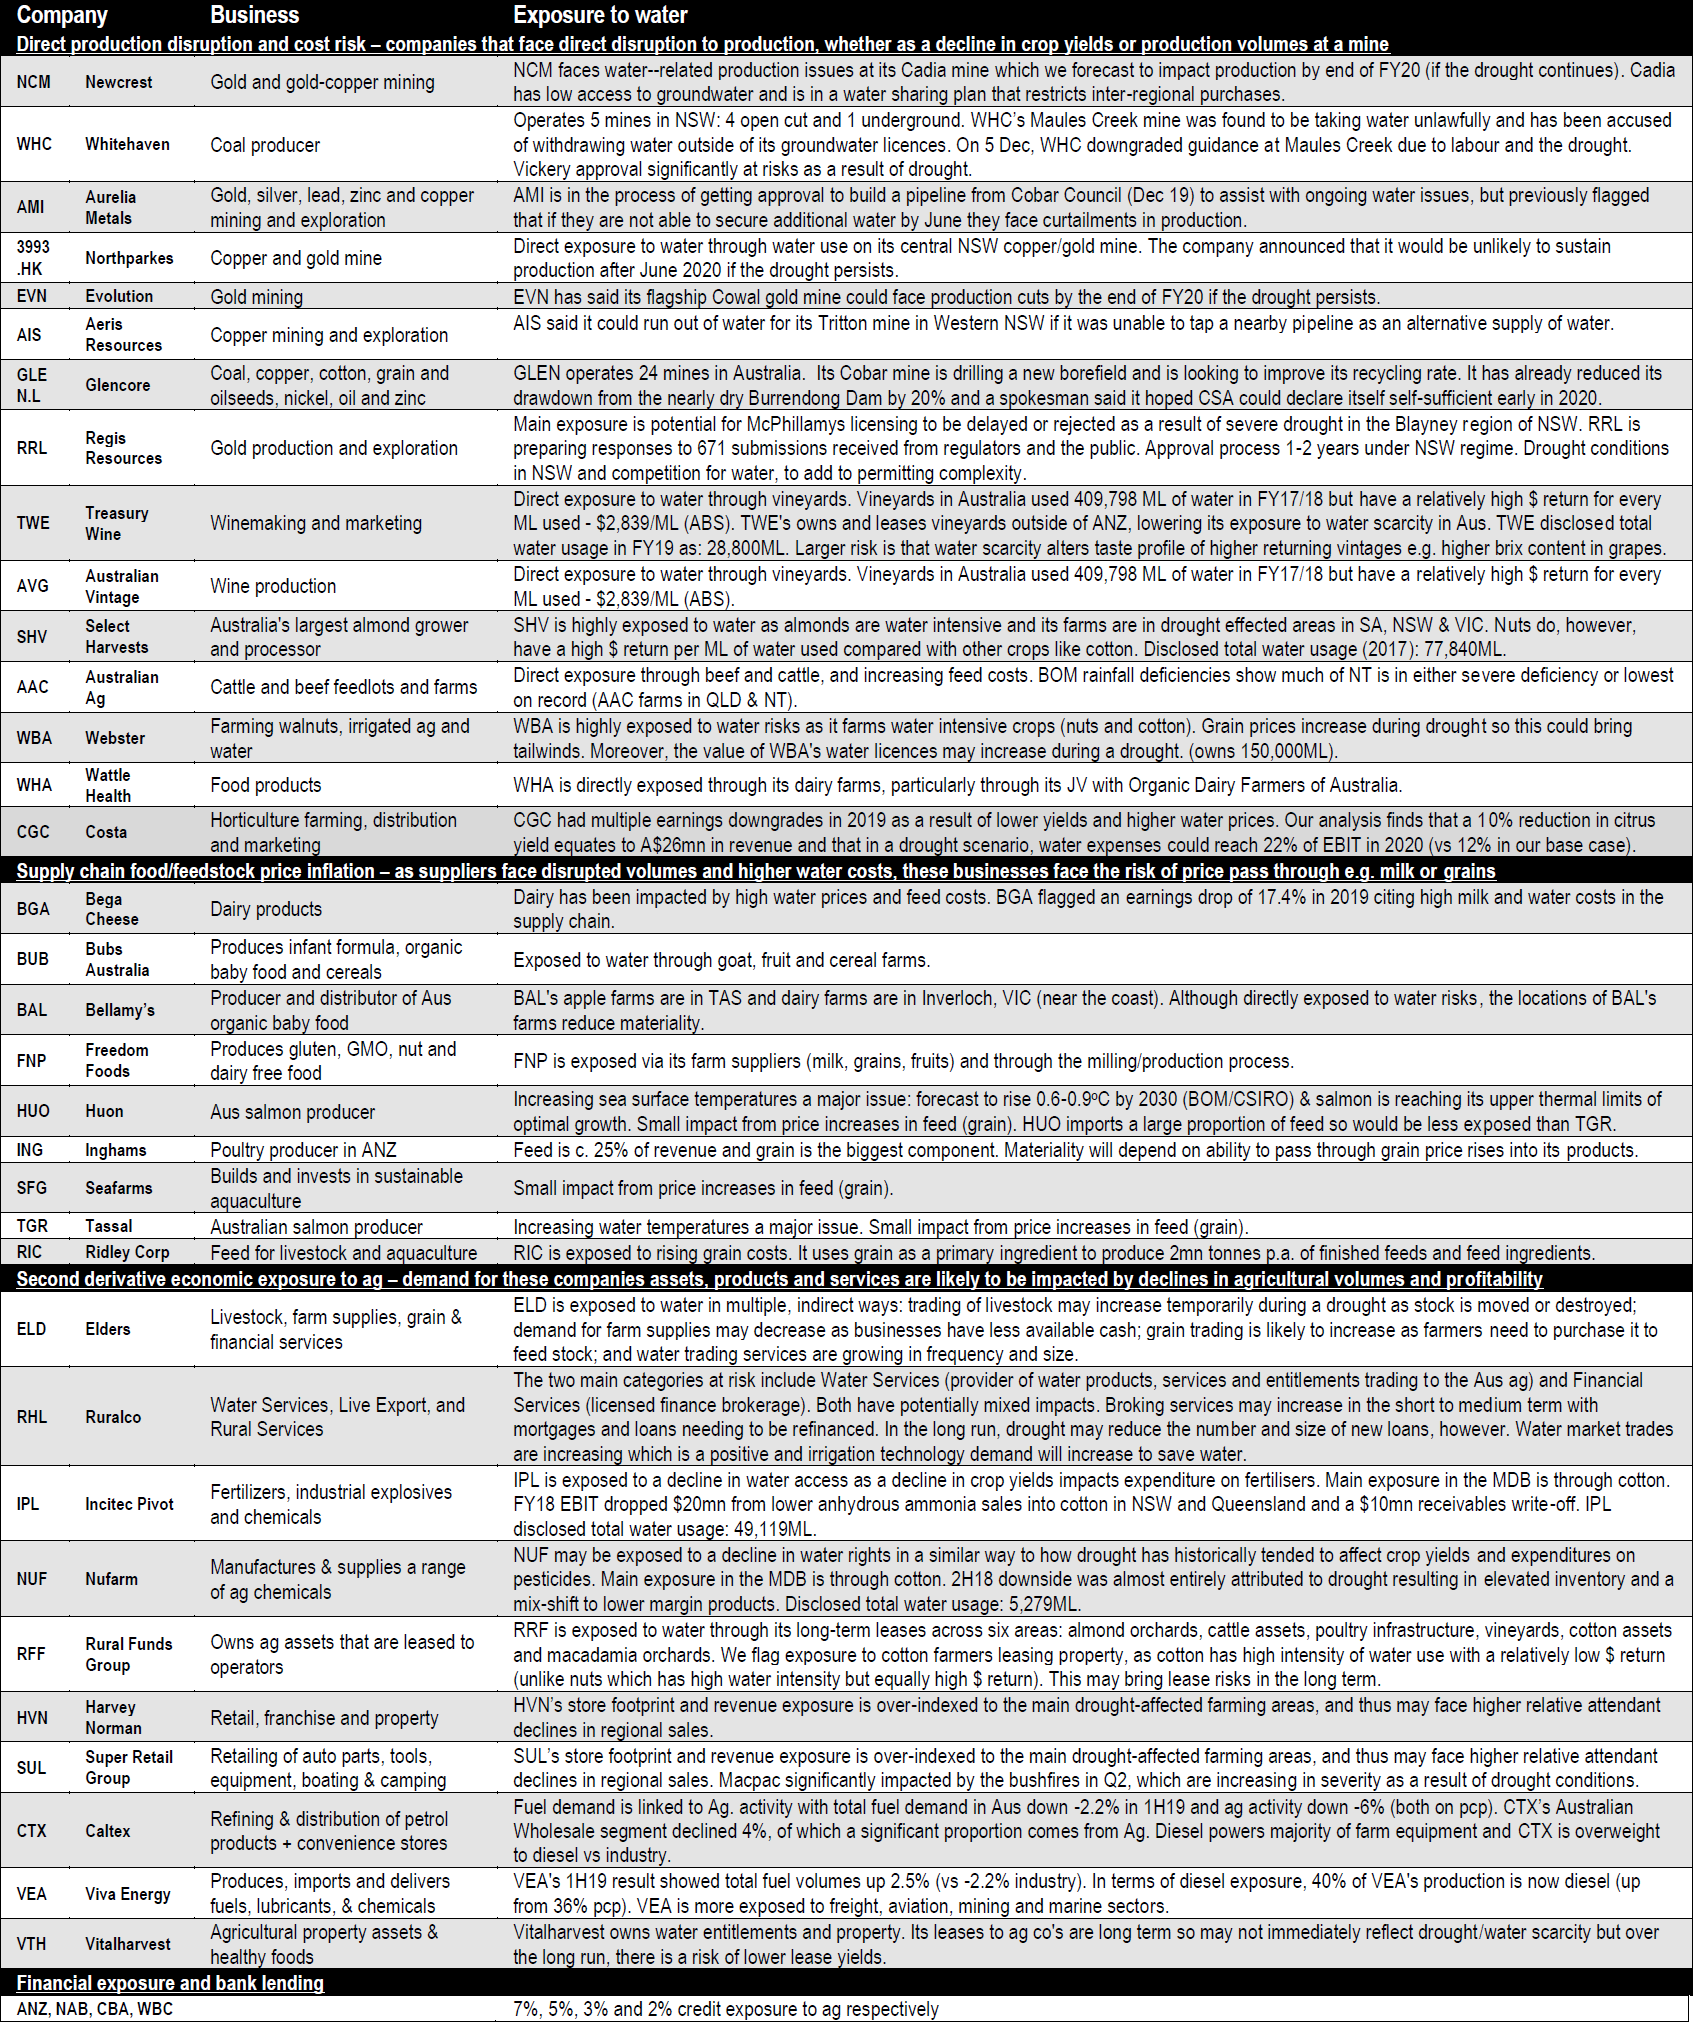
The effects of water on the ASX
There are over 25 companies on the ASX with exposure to this theme. The table below lists each of them along with some information about their exposure to water scarcity
Learn more
The above wire was an extract from the our full paper "Water Scarcity: Addressing the key challenges", which you can read below.
Never miss an update
Enjoy this wire? Hit the ‘like’ button to let us know.
Stay up to date with my current content by
following me below and you’ll be notified every time I post a wire
Phin joined Credit Suisse in April 2018, having previously worked at Macquarie Bank in the same position. His career has spanned investment research, fund management and ESG specialisms. Phin previously co-founded the UK Investor Forum

2 topics
32 stocks mentioned
Phineas Glover
Head of APAC ESG Research
Credit Suisse
Phin joined Credit Suisse in April 2018, having previously worked at Macquarie Bank in the same position. His career has spanned investment research, fund management and ESG specialisms. Phin previously co-founded the UK Investor Forum
Expertise
Comments
Comments
Sign In or Join Free to comment
most popular
Investment Theme
If 24 LICs ran the Melbourne Cup, which ones would we back?
Affluence Funds Management