The Budget Dust Settles

Clime Investment Management
Clime Investment Management
A week after the fanfare of the 2018/19 Budget, we can soberly review some of the information and data that supports its projections. In the body of the Budget papers are a wealth of tables and charts that contain important observations and insights into the Australian economy. We scan through those that we believe are most important below.
Economic forecasts
Our first table outlines Treasury’s forecasts for growth amongst our major trading partners and the world’s largest economies. Synchronised growth is anticipated, but with a widening spread of outcomes. While both China and India power on, the moribund state of Japan is evident. The growth projected for the US suggests little momentum is gained from President Trump’s expansionary policies and tax cuts. Meanwhile, European growth drifts lower, suggesting (as with Japan) that sustained QE and negative real interest rates do little to support growth.
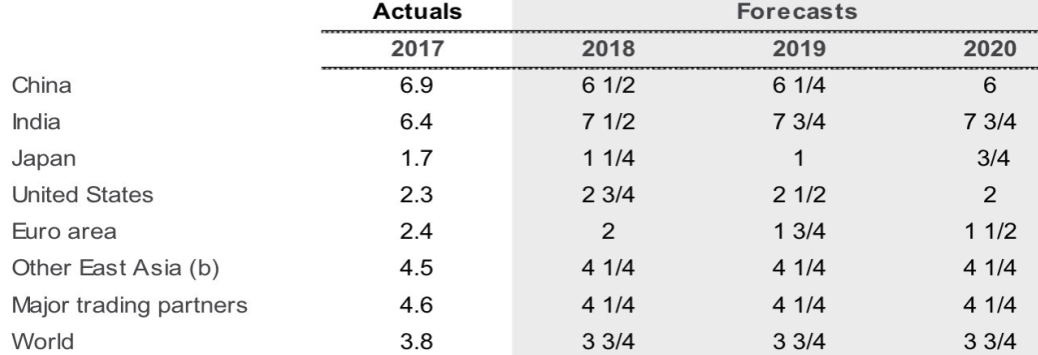
Figure 1. International GDP growth forecasts
Source. Budget Papers
For Australia, Treasury forecasts a solid and sustained growth outlook – 3% per annum real growth. Employment growth will be moderate and real wage growth is to be sustained. Overall, this is a sound growth outlook that supports budget outcomes – a move back to surplus – as more people are employed and pay tax. Company tax collections are also expected to rise in this environment.
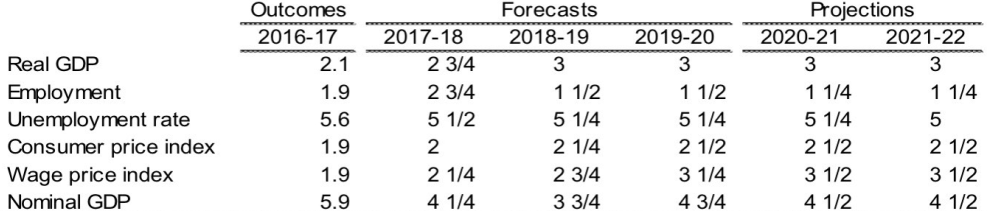
Figure 2. Major economic parameters
Source. Budget Papers
The growth forecast for Australia sits just below the 20-year average rate, albeit set at a remarkably stable level that belies past experience.
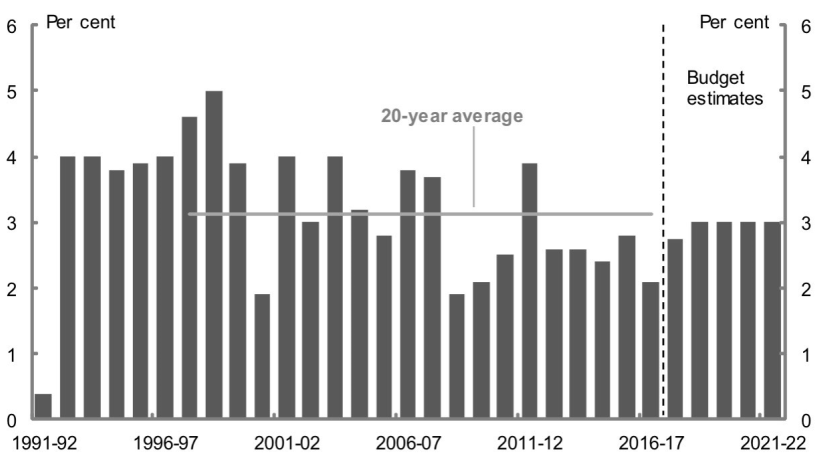
Figure 3. Real GDP growth
Source. Budget Papers
The budget outcomes
The return to surplus has been delayed as tax cuts are passed through this year’s Budget. In any case, the forecast deficit of $14.5 billion represents just 0.8% of GDP. By comparison, the US Government is currently projected to have a budget deficit of between 4% and 5% of GDP in 2019.
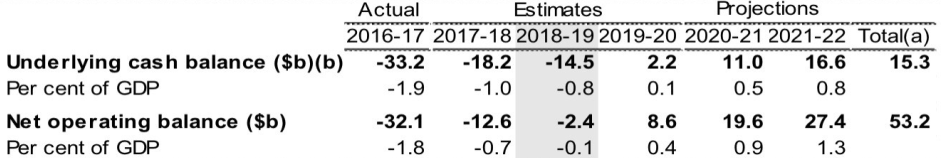
Figure 4. Budget aggregates
Source. Budget Papers
Receipts of $473 billion represent 24.9% of GDP of $1.9 trillion. On the other side of the ledger, the Government will outlay $484 billion representing 25.4% of GDP. The increase in outlays – up from 2018/19 – suggests that pre-election giveaways will be available if needed.
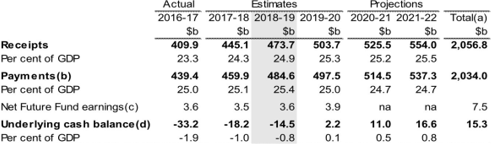
Figure 5. Australian Government general government sector budget aggregates
Source. Budget Papers
The longer-term forecasts, taking the Budget deeper into surplus, suggest a declining level of actual debt and as a percentage of GDP. Over the next decade, net Commonwealth debt is forecast to decline from 18% of GDP to 5%. Based on this forecast, Joe Hockey’s “budget crisis” of 2014 has become a faint memory – no wonder he failed to achieve the accolade of “World’s Best Treasurer” that his predecessors Wayne Swan (in 2011) and Paul Keating (in 1984) so famously achieved (well, as per Euromoney magazine, not quite the Nobel Prize for Economics).
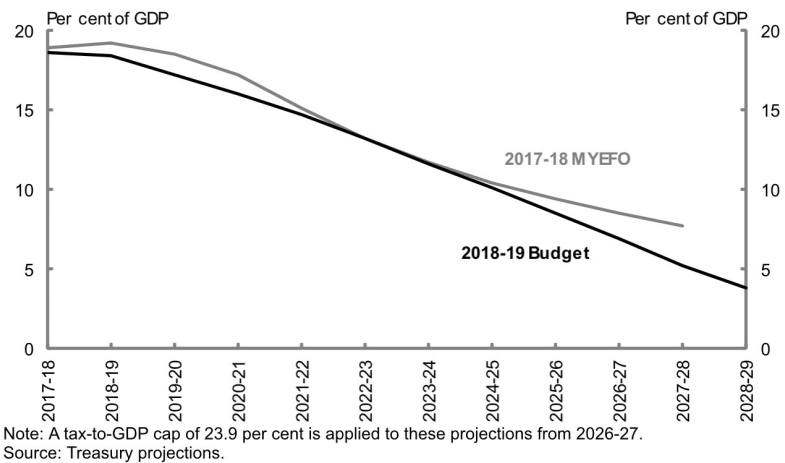
Figure 6. Net debt projected 2028-29
Source. Budget Papers
Investment and housing
The rolling business investment and housing investment cycles are captured in the next chart. Over the last decade, these have rarely been in sync and the Australian economy has therefore been at little risk of “overheating”. This has meant the RBA has been able to be supportive of the economy through very low cash rates settings. The mining investment boom is in its dying days, but solid growth in broader business investment is good news - more so at a time of slowing housing investment. Prudential controls on bank residential lending are working well.
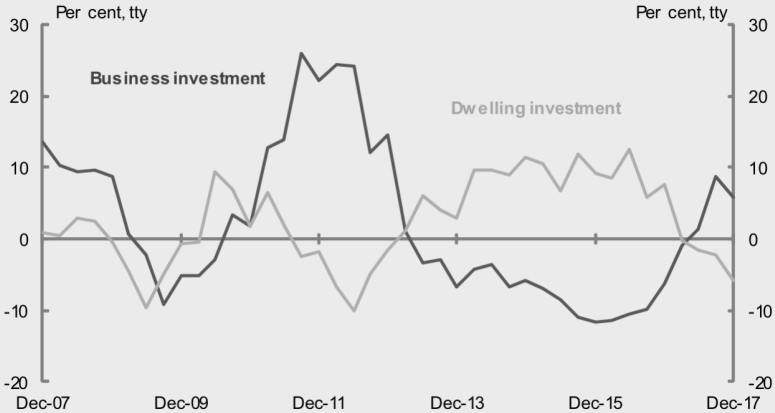
Figure 7. Alternating cycles in business and housing investment
Source. Budget Papers
The recent dwelling investment cycle has been very strong, with a doubling of commencements (per annum) seen over the last decade. This has been essential to meet the strong level of population growth supported by robust net immigration. However, the mining states (notably WA) have struggled as the mining investment boom peaked. The focus of residential growth in the SE of Australia has created bottlenecks in infrastructure and support services. Our view is that much more must be done to direct population growth away from Sydney and Melbourne.
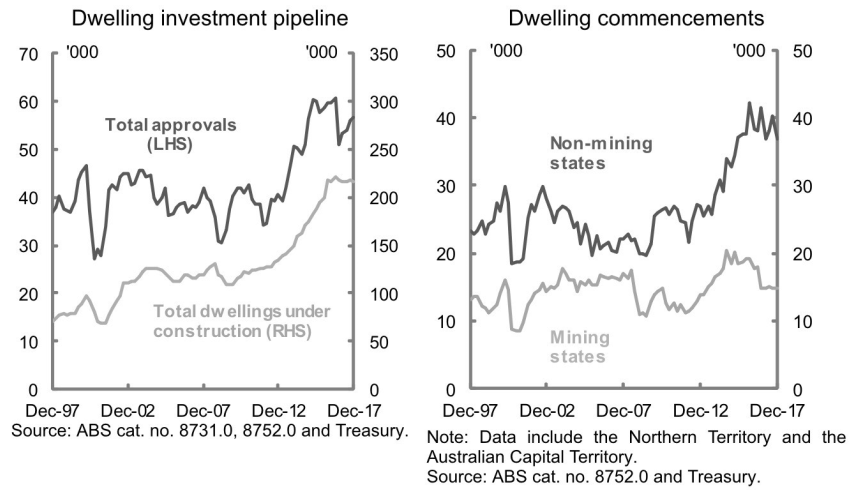
Figure 8. Indicators of dwelling investment
Source. Budget Papers
We note the lift in non-mining investment over recent years. It comes after a near decade of stagnation; today’s non-mining investment is a mere 8% of GDP and equivalent to the level of the 1992/93 recession. Simply stated – Australian business needs to invest a lot more to sustain the non-mining economy and to create meaningful jobs in value added industries.
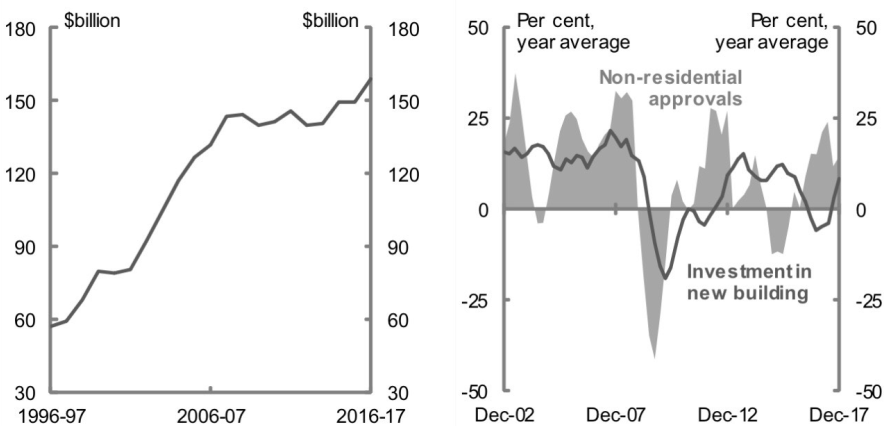
Figure 9. a) Real nonmining business investment b) Nonresidential building approvals and investment
Source. Budget Papers
Exports and commodities
The following extract from the Budget outlines succinctly the returns that have emanated from the massive mining investment boom. While export production will slow in relative terms as this decade concludes, the doubling of output is impressive. Australia’s evolution as a world leading exporter of LNG is tempered somewhat by the dominance of foreign ownership in this sector and the lack of planning in securing supply to the domestic economy.
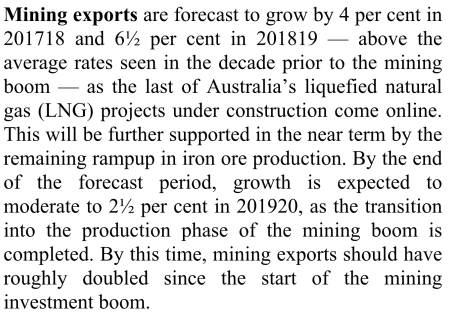
The next chart shows the tight relationship between global oil prices and the price of Australian LNG exports. Since 2014, the decline of oil prices coincided with the ramp-up of Australia’s LNG production. Today, oil prices are lifting with OPEC cutting supply and Middle East tension. A lift in oil prices to $80 a barrel will also lift LNG export prices (outside fixed price agreements). While this will support Australia’s trade account, excessive overseas ownership means much of the LNG price recovery will be lost through the current account as profits are dispersed to foreign owners. The offset will be Australian taxes and royalties paid to Australian governments. Therefore, a mining and resource tax – one that is fair, equitable and transparent – is important for Australia’s future.
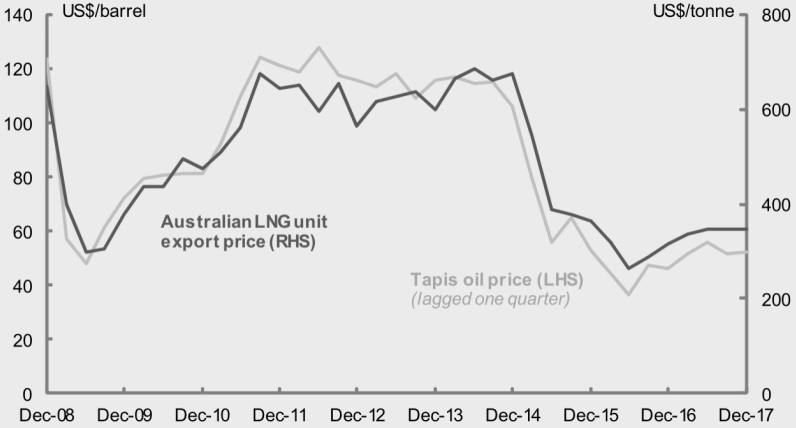
Figure 10. Oil prices continue to influence Australian LNG pricing
Source. Budget Papers
Employment and taxation
We noted above the solid employment growth forecast in the Budget over the next few years. This continues a trend evident from the charts below. Employment growth of 400,000 jobs over the last year is remarkably high and 300,000 full time jobs is impressive. More jobs – particularly full time – support higher revenue projections for Treasury.
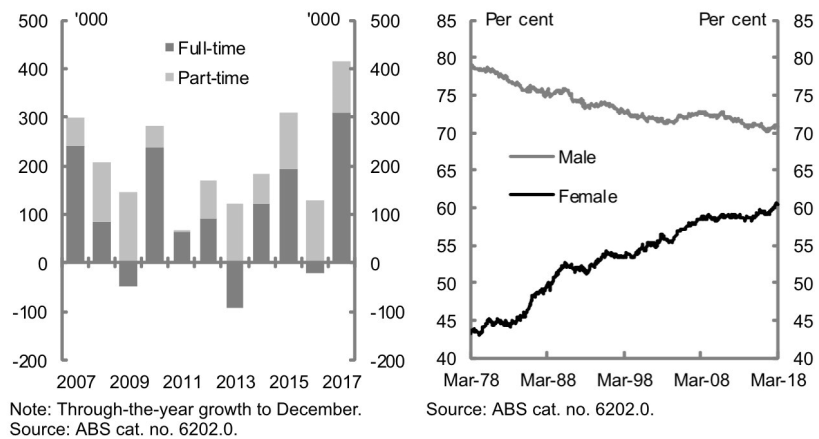
Figure 11. a) Employment growth b) Participation rate by gender
Source. Budget Papers
Over the longer term, the transition of the Australian workforce is apparent as more women enter the workforce with their participation rate reaching all-time highs. This growth is explained by a range of factors: smaller and “broken” families; the economic imperative for two income earners in a household; and the proliferation of service jobs in sectors such as aged care, health and education that have high levels of female participation.
The next chart is telling on several fronts. Over the last year, about 40% of job creation across Australia has been health care and social assistance related. An ageing population and higher demand for quality of health services across the population is driving this need. The chart also reveals that outside construction, there is little growth of note in the manufacturing or value-added production areas.
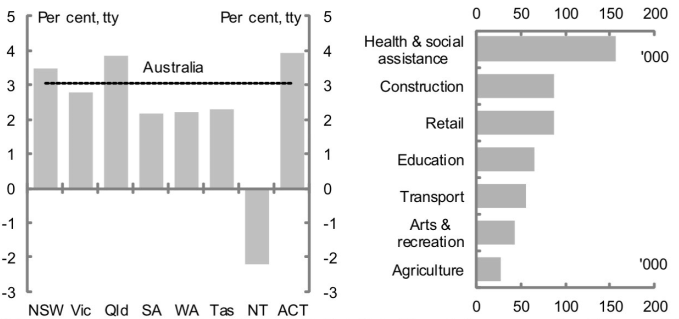
Figure 12. a) Employment growth by state & territory b) Employment growth in selected industries
Source. Budget Papers
It is the type of jobs created across the economy that ultimately influences the level of wages growth. The table above suggests lower paid service jobs dominate employment growth, and this has longer term repercussions for the budget. More jobs are good, but lower (below average) salaries are not. This trend drives the need for tax relief (or compensation) for low income earners and a higher burden on top income earners.
The tables show some ongoing problems in employment inside mining states (WA and NT). These trends need to be monitored as they could lead to the migration of workers to SE Australia. Thus, the below trend employment growth in Victoria is a growing concern. Excessive population growth, without employment growth, leads to social issues. It is arguable that the population growth of Melbourne is occurring at too fast a rate.
The next chart is interesting because it compares Australia’s top marginal tax rate with our international peers. Our top marginal rate is relatively high and it cuts in at a low multiple of average earnings. Overseas countries like France and Japan have higher top rates, but they cut in at large multiples of average earnings.
In the raging debate regarding excessive executive salaries, highlighted by the Financial Services Royal Commission, it seems remarkable that social commentators have not proposed that the highest rate of income tax should cut in at, say, 6 times average Australian wage rates. The flat tax proposal by the Government, which proposes the highest rate at barely above average wage rates, does not address the excessive salaries claimed by a select few individuals. Arguably it is a tax rate that supports highly paid parliamentarians and bureaucrats that conveniently flows through to the private sector. Maybe it is time for tax rates to be determined outside Parliament – a think tank from across society - as there are far too many conflicts of interest that exist.
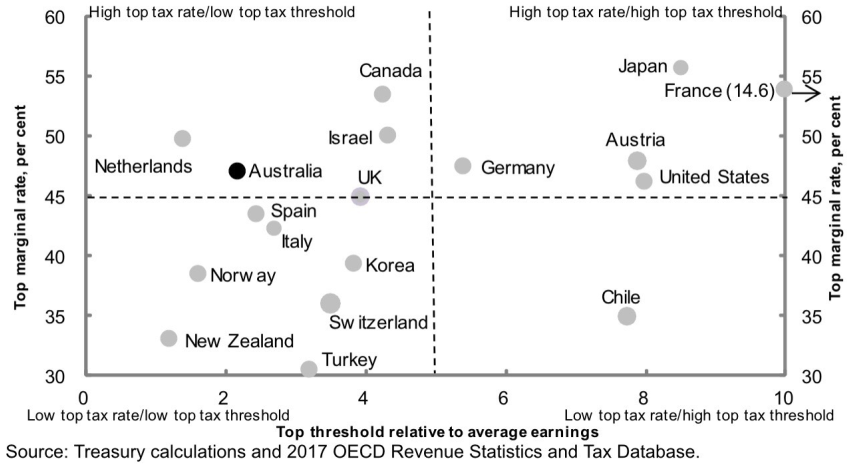
Figure 13. Top marginal tax rates and thresholds relative to avg fulltime earnings, selected OECD nations 2017
Source. Budget Papers
Government debt
The Commonwealth’s balance sheet is forecast to improve over the next five years, with net debt declining from $341 billion to $319 billion in 2022. The forecast total liabilities of the Commonwealth are built upon a number of assumptions outside budget surpluses. For instance, the ability of the Future Fund to meet unfunded Commonwealth employee pensions. Also, the capacity of the NBN to repay billions in debt owed to the Commonwealth to fund its roll out.
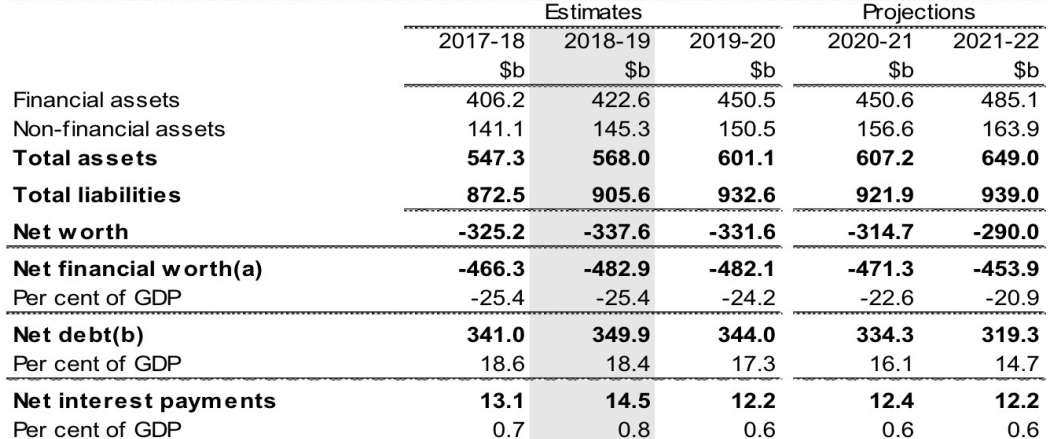
Figure 14. Net worth, net financial worth, net debt and net interest payments
Source. Budget Papers
The next chart more precisely forecasts Commonwealth net debt and the resultant effect on interest payable through the Budget. It is interesting that the projected underlying cash deficit in 18/19 is equivalent to the net interest payable on Commonwealth debt ($14 billion). Pre-debt servicing, Australia’s budget is balanced.
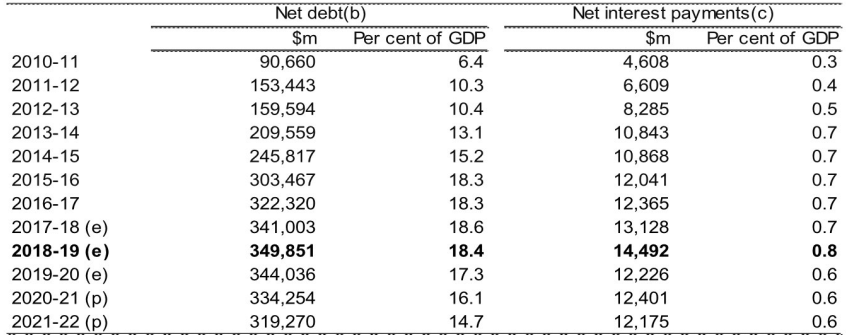
Figure 15. Australian Government general government sector net debt and net interest payments (cont.'d)
Source. Budget Papers
Australia’s Commonwealth gross debt of about $560 billion trades through the bond and securities markets. While the percentage of foreign ownership of Commonwealth bonds has declined from its peak level (78% in 2012), there is approximately $300 billion held by foreigners today. This results in about $7 billion of interest being paid to foreign investors per annum.
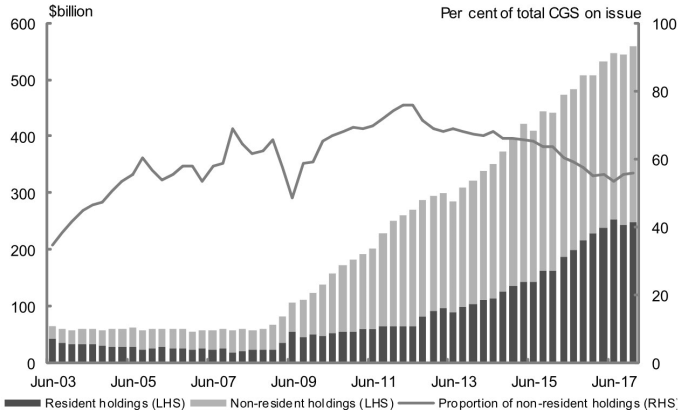
Figure 16. Nonresident holdings of Commonwealth Government Securities
Source. Budget Papers
The declining bond yield environment, buoyed by QE around the world, creates an interesting result. The Commonwealth has issued $523 billion of debt that trades at market values of $563 billion.
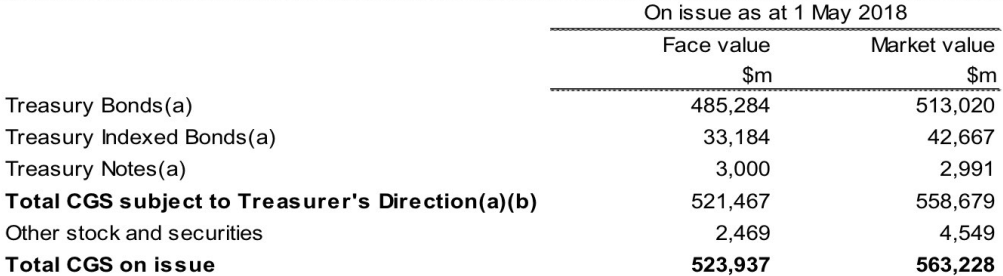
Figure 17. Breakdown of current Commonwealth Government Securities on issue
Source. Budget Papers
The legacy of high yielding bonds issued before the GFC are seen in the table below. As high yielding bonds mature, there is a natural benefit to the Budget bottom line. Over $80 billion of bonds costing more than 5% per annum will mature and be refinanced by 2023. At current market rates, the Budget outcome could improve by $1.5 billion per annum as bonds are reset.
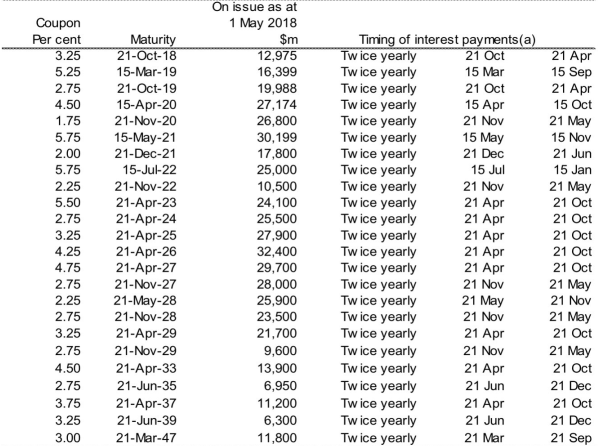
Figure 18. Treasury Bonds on issue
Source. Budget Papers
Final thoughts and the Future Fund
The Commonwealth continues to allow the Future Fund to grow unencumbered by the need to pay out pensions. It remains in accumulation mode as Commonwealth service pensions are paid from consolidated revenue.
The Commonwealth Budget does not claim Future Fund earnings in its underlying deficit, but it does review it in terms of the Commonwealth balance sheet. With $140 billion in assets, the Fund is still underfunded by an estimated $60 billion – with actuarial liabilities of about $200 billion.
Away from that sobering observation, the next table is instructive as it discloses the Fund’s asset allocation as it seeks a return of about 6.5% per annum.
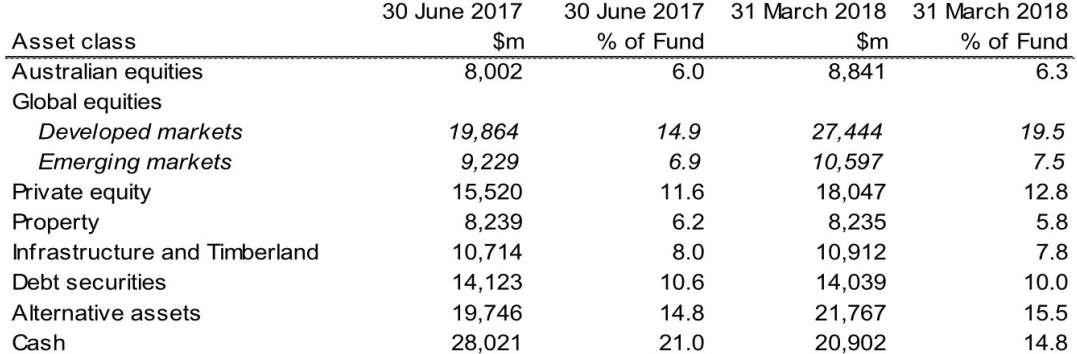
Figure 19. Asset allocation of the Future Fund
Source. Budget Papers
The asset allocation shows a substantial underweight in Australian shares (6.3%) and a large weighting to unlisted securities such as property (direct), debt securities, private equity and infrastructure. From this, SMSF trustees should examine their own asset allocations and consider whether their direct yielding investments are set at appropriate levels. The high level of cash (15%) has come down from an even higher 20% in June 2017.
Our final table shows the burgeoning debts/loans being created through education loans (HECS) to create a highly skilled workforce for the future.
This debt will grow by $10 billion over the next 4 years and continues a trend of ever increasing debt (education and household) amongst younger members of society.
Today, young people are being asked to put wages aside for a pension they may (or may not) receive in 40 years’ time, to save for a mortgage for a house they cannot afford, to bring up a family with expenses that require two incomes, and if they achieve a tertiary education, to pay back a debt that their parents were not burdened with.
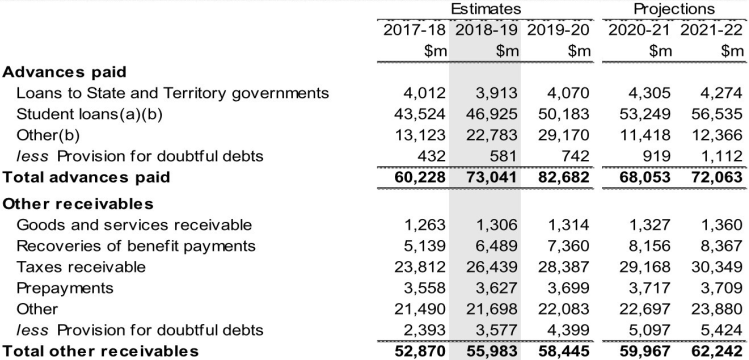
Figure 20. Advances paid and other receivables
Source. Budget Papers
It is time for a rethink. Perhaps the older generation may be able to help through a sensible negotiation (or offset) of franking credits (reduced to a sensible limit rather than abolished) for a HECS debt waiver.
Our thoughts are this. It is time for the older generation of Australians to align with the younger generation before politicians build a wall between them. It is also time for Australia’s tertiary education system to be managed so that excessive debt is not endlessly created for a younger generation whom are increasingly jealous of their baby boomer parents.
Never miss an update
Enjoy this wire? Hit the ‘like’ button to let us know.
Stay up to date with my current content by
following me below and you’ll be notified every time I post a wire
The Clime Group is a respected and independent Australian Financial Services Company, which seeks to deliver excellent service and strong risk-adjusted total returns, closely aligned with the objectives of our clients.

8 topics
Clime Investment Management
Funds Management & Stock Research
Clime Investment Management
The Clime Group is a respected and independent Australian Financial Services Company, which seeks to deliver excellent service and strong risk-adjusted total returns, closely aligned with the objectives of our clients.
Expertise
Clime Investment Management
Funds Management & Stock Research
Clime Investment Management
The Clime Group is a respected and independent Australian Financial Services Company, which seeks to deliver excellent service and strong risk-adjusted total returns, closely aligned with the objectives of our clients.
Expertise
Comments
Comments
Sign In or Join Free to comment