The great unwind comes... slowly

Clime Investment Management
Clime Investment Management
When the US Federal Reserve (“the Fed”) Chair announced the much anticipated increase in the Federal Funds or cash rate on 15 March, she noted that the Fed intended to maintain the size of its balance sheet through this calender year. In other words the Fed would, for at least the next 9 months, reinvest the cashflow from the maturities received on its massive $4.5 trillion balance sheet back into US bond and mortgage markets. The net income it receives on its investments flows back to the US Treasury in a great round robin (see below).
This is described by economists as “a sanitised form of quantitative easing” as it does not increase nor decrease the size of the Fed’s balance sheet. It allows the Fed to remain active in supporting US bond markets by reinvesting its cashflow along the bond maturity curve. It therefore can maintain an orderly bond market wherever and whenever support is needed. This will be essential as interest rates normalise.
The Chair’s statement was glossed over by market commentators for it appeared to maintain the Fed’s unrelenting support for the US bond market that had commenced with Quantitative Easing (“QE”) 1 in late 2008. This support is emphasised in the first chart below, which reminds us that QE 1 was an emergency $2 trillion program that injected seemingly unlimited liquidity into the US economy at a time when liquidity was drying up and the risk of economic calamity was high.
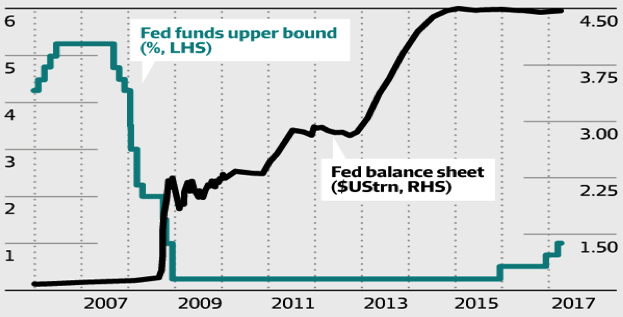 Figure 1. Fed funds v Fed balance sheet
Source. BoA Merrill Lynch Global Research
The next chart from Merrill Lynch shows the longer-term context of the succession of QE programs (1, 2 and 3) and forecasts a very slow tapering commencing in 2018. By not reinvesting the income and capital proceeds from its portfolio, from 2018 the Fed will reduce the monetary base of the US economy by a mere $0.5 trillion over 3 years.
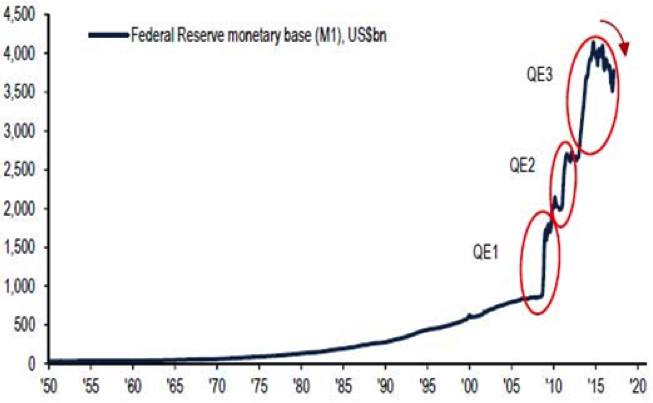
Figure 2. End of central bank 'liquiidty supernova'
Source. BoA Merrill Lynch Global Investment Strategy, Federal Reserve
Late last week, the official minutes of the 15th March Fed meeting were released and a bit more colour was put on the “sanitisation program” . The minutes noted that …
"Provided that the economy continued to perform about as expected, most participants anticipated that gradual increases in the federal funds rate would continue and judged that a change to the committee's reinvestment policy would likely be appropriate later this year. Many participants emphasised that reducing the size of the balance sheet should be conducted in a passive and predictable manner."
This announcement appears to have taken the wind out of the rollicking US Trump rally. The S&P 500 has drifted aimlessly since (down 1%), as market participants try to comprehend what the Fed meant by “passive” and “predictable”.
What is clear from the statement is that the unwinding of the Fed balance sheet will take years. At this point, the Fed is not suggesting that it will sell down either its holdings of US bond or mortgage backed securities. The chart below shows the size and classification of the Fed holdings.
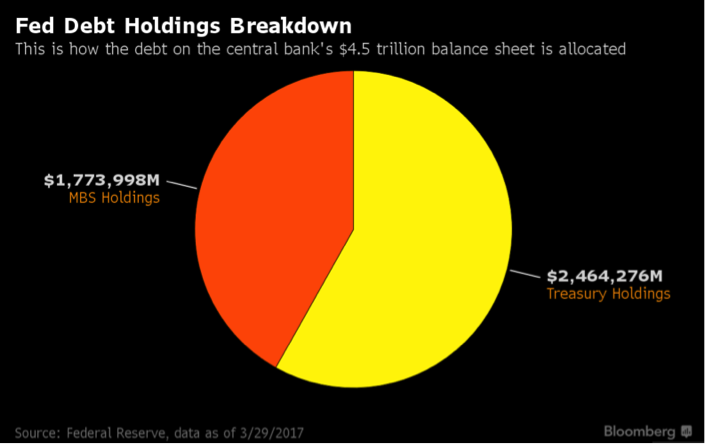
Figure 3. Fed debt holdings breakdown
Source. Bloomberg, Federal Reserve
In one of the great financial round robins of our time, the Fed pays the US Federal Treasury remittances that it earns from its investments that include bonds issued by Treasury. In 2016 an estimated $92 billion was paid to Treasury to help the US government fund its fiscal deficit. Over the last 9 years, about $700 billion has been returned to the US Treasury by the Fed.
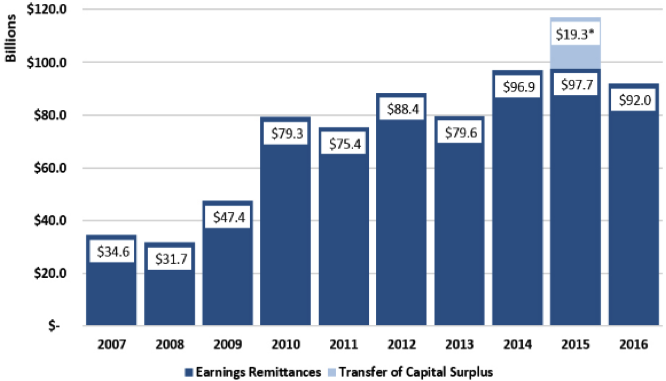
Figure 4. Federal Reserve Remittances to the US Treasury
Source.
The benefit of repayment is that the Fed does not grow its balance sheet by retaining the income it receives. The $92 billion paid in 2016 is after payments made on deposits with the Fed from the US banking system. Therefore, the Fed earns a healthy net interest margin of 2% on its balance sheet investments that was built on printed money.
The payments to the US Treasury help reduce the reported US fiscal deficit. In each of the last three years, it has reduced the reported deficit by over $90 billion, representing 15% of the underlying deficit. The repayment therefore reduces the requirement to issue new bonds by a similar amount. In this way, QE has supported the US Government in funding its deficits over the last ten years.
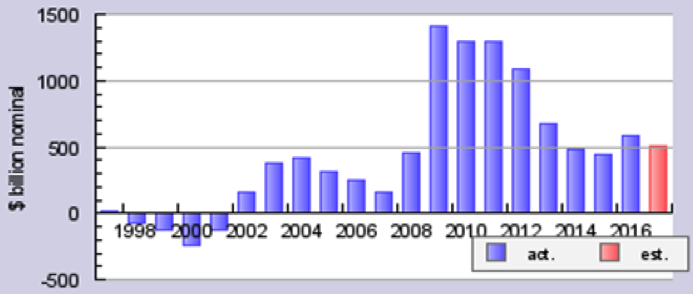
Figure 5. Federal Defecit, US from FY1997 to FY 2017
Source. usgovernmentspending.com
Having adjusted its target interest rate, guided to up to three more increases this year and flagged the end of its sanitised QE, the Fed is watching market reactions. So far, it has observed that while the US equity market has stalled, the US bond market appears unfazed - indicated by ten-year bonds trading at a 2.4% yield. Meanwhile, the USD has firmed against a basket of currencies (including the A$) and this is probably the current major concern for the Fed.
A sharply appreciating USD would certainly have ramifications for US exports and international company earnings. It would therefore check US earnings growth and threaten the US equity market, which has rallied hard for 8 years on the back of sustained lower interest rates and the massive liquidity injected by the Fed.
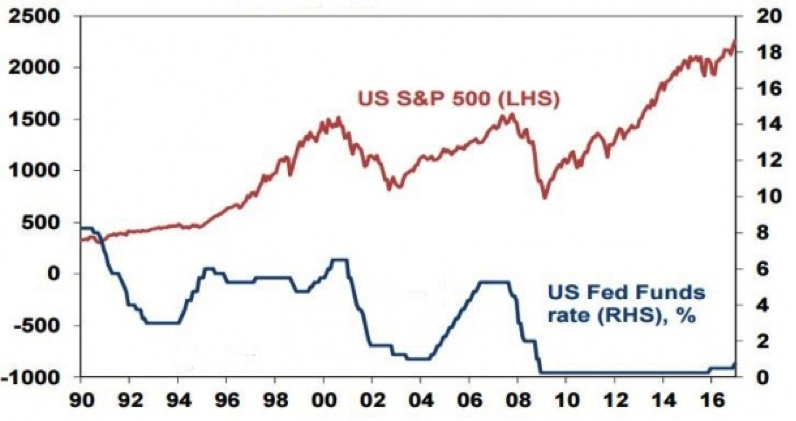
Figure 6. US S&P 500 v US Fed Funds
Source. BoA
In our view QE, like so many other economic policies around the world, has been introduced without any real plans for how it would be withdrawn. Its introduction was based on the hope that it would avert economic disaster, and to an unknowable extent it has succeeded in this respect (there is no counterfactual) - but its continued use is excessive and it has created major distortions in the workings of asset markets.
It is early days in the unwinding of the elements of QE and near zero interest rates in the US. While we are encouraged by the initial market responses, we remain to be convinced that the many interactions and ramifications of QE (some described above) are truly understood.
The maintenance of QE and negative interest rates remains a feature of the European and Japanese economies. The moves by the Fed have not been matched by either the ECB or the BOJ.Therefore the normalisation of monetary conditions in the US will take many years, simply because normalisation cannot occur unless it is truly global across the major economies.
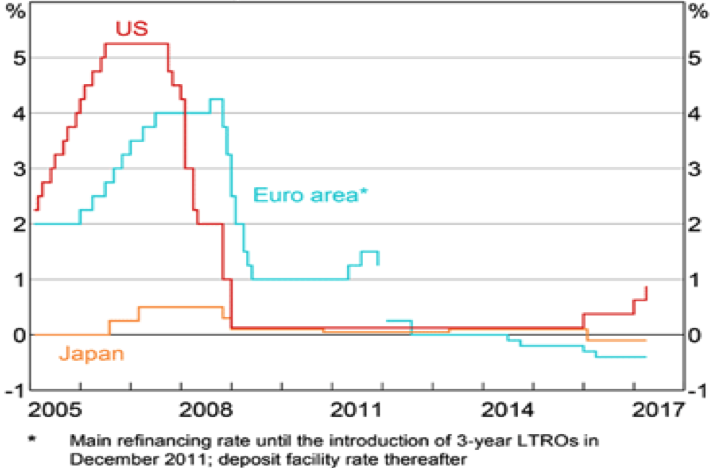
Figure 7. Policy Interest Rates - G3
Source. Central Banks
Europe’s QE program
Eurozone QE started in March 2015, well after the US, and there have been 4 main episodes to its ongoing program. These have been:
- 9 March 2015 (decision to purchase €60 billion of assets per month until September 2016),
- 3 December 2015 (extension of QE until March 2017),
- 10 March 2016 (to increase monthly purchases from €60 billion to €80 billion from April 2016),
- 8 December 2016 (extension of QE until December 2017, but at a reduced monthly pace of €60billion).
As at January 2017, the Euro authorities had purchased €1.6 trillion of assets under the Asset Purchase Plan since March 2015. It is scheduled to buy a further €682 billion of assets until December 2017. These assets are made up of both public debt (bonds) and corporate debt.
The effect on bond yields across Europe is clear to see in the following table. It compares the yields in June 2014 to February 2017.
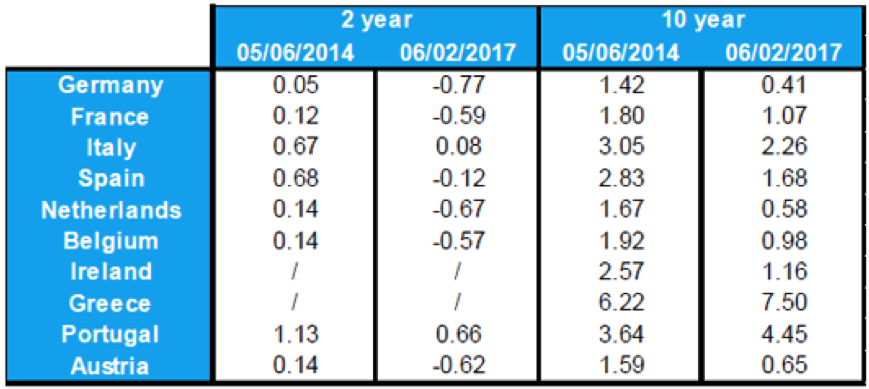
Figure 8. 2-year and 10-year Bond Yields
Source: Amundi Asset Management
Based on ECB commentary, and despite better economic growth and inflation readings, there is little likelihood that the ECB will change course with its QE program in 2017. Long-term yields are a long way from normal and asset markets will surely be tested when the great unwind commences – hopefully in 2018.
Japanese QE Program
The balance sheet of the Central Bank of Japan (BOJ) has reached 90% of Japan’s GDP and its “bazooka” QE policy is said to be fast approaching a natural barrier.
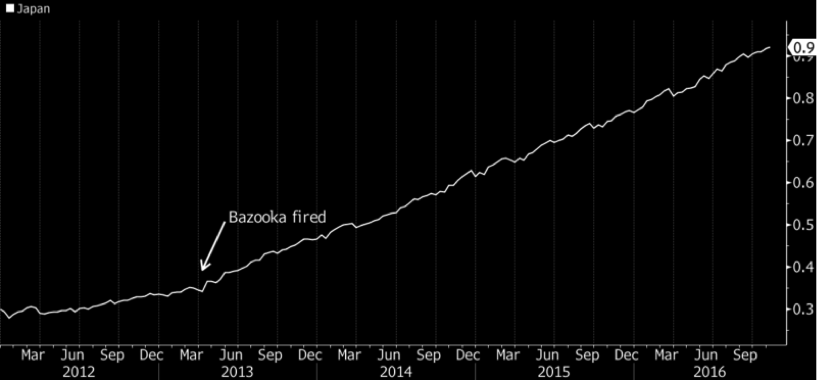
Figure 9. BoJ balance sheet as percentage of GDP
Source. Bloomberg
Commentators suggest that 2018 could be the year of the taper. The continuing BOJ guideline of buying an annual 80 trillion yen (US $734 billion) of bonds - amounting to 16% of GDP - will at some point run up against operational limits. Current owners of securities won’t part with their holdings in the amounts the BOJ needs to buy.
BOJ Chairman Haruhiko Kuroda does not currently see its 2% inflation target being achieved until at least March 2019, and has pledged to keep boosting the monetary base until they overshoot that target. That means years of more stimulus to come - but fewer and fewer bonds left to buy.
Like the ECB policy, the Japanese QE program makes it difficult for the Fed to quickly normalise interest rates. Indeed the BOJ has gone too far and for too long in purchasing assets. The purchases have extended to equity ETFs and now the BOJ is tacitly admitting that its policies have failed to inflate the economy. Worse still, the policy has destroyed the income returns available to Japanese pension funds and this is leading to an exit of capital into offshore markets (one of which is the US bond market).
What does this mean for investors?
While the US Federal Reserve is clearly on track to increase short-term interest rates and allow the US bond market to eventually trade free of intervention, this will take many years. It will be a tortuous period for investors with asset returns likely to be well below long-term averages.
Across the world, central banks have failed to coordinate their policies and the excessive length of each policy has created asset bubbles across bond, equity and some property markets. Indeed, it seems that SE Australian residential property fits into this category.
From an Australian investment perspective, it is difficult to see how asset returns can surprise except through a bout of debt-driven optimism. Australian interest rates are at historic lows - no surprises there given the world environment – but more important to note is the differential between our rates and the US.
The final chart indicates the problem for fixed interest investors generally and bond investors specifically. The margin between US and Australian bond yields has fallen to historic lows. While the margin could decline further, it would seem – based on history – that this trade is substantially over.
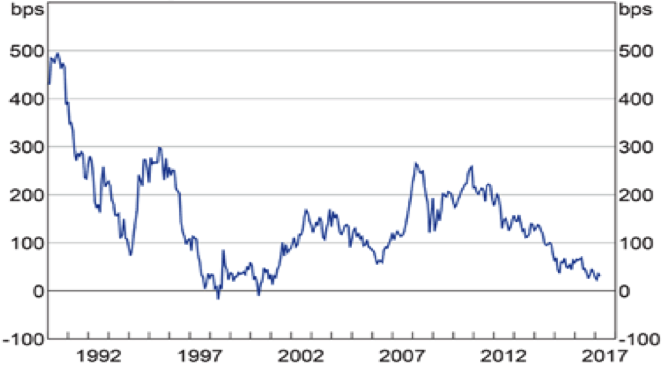
Figure 10. Differential between Australian and US 10-year Government Bond Yields
Source. Bloomberg, RBA
Therefore as the Fed reflates its bond yields, Australian bond yields will likely follow, or our currency will devalue – indeed maybe a bit of both. It is not a time to be passive in asset allocation, and it seems clear that investors should seek out floating and/or inflation-hedged yields. Expected returns must be adjusted down and promises of capital gains regarded with scepticism – in other words, consistently banked.
Never miss an update
Enjoy this wire? Hit the ‘like’ button to let us know.
Stay up to date with my current content by
following me below and you’ll be notified every time I post a wire
The Clime Group is a respected and independent Australian Financial Services Company, which seeks to deliver excellent service and strong risk-adjusted total returns, closely aligned with the objectives of our clients.

6 topics
Clime Investment Management
Funds Management & Stock Research
Clime Investment Management
The Clime Group is a respected and independent Australian Financial Services Company, which seeks to deliver excellent service and strong risk-adjusted total returns, closely aligned with the objectives of our clients.
Expertise
Clime Investment Management
Funds Management & Stock Research
Clime Investment Management
The Clime Group is a respected and independent Australian Financial Services Company, which seeks to deliver excellent service and strong risk-adjusted total returns, closely aligned with the objectives of our clients.
Expertise
Comments
Comments
Sign In or Join Free to comment