5 charts that show housing could fall further
Let's take a step back from the monthly housing data and ask ourselves: What's happening in the market and are we seeing a bottom in prices - or are there further falls to come?
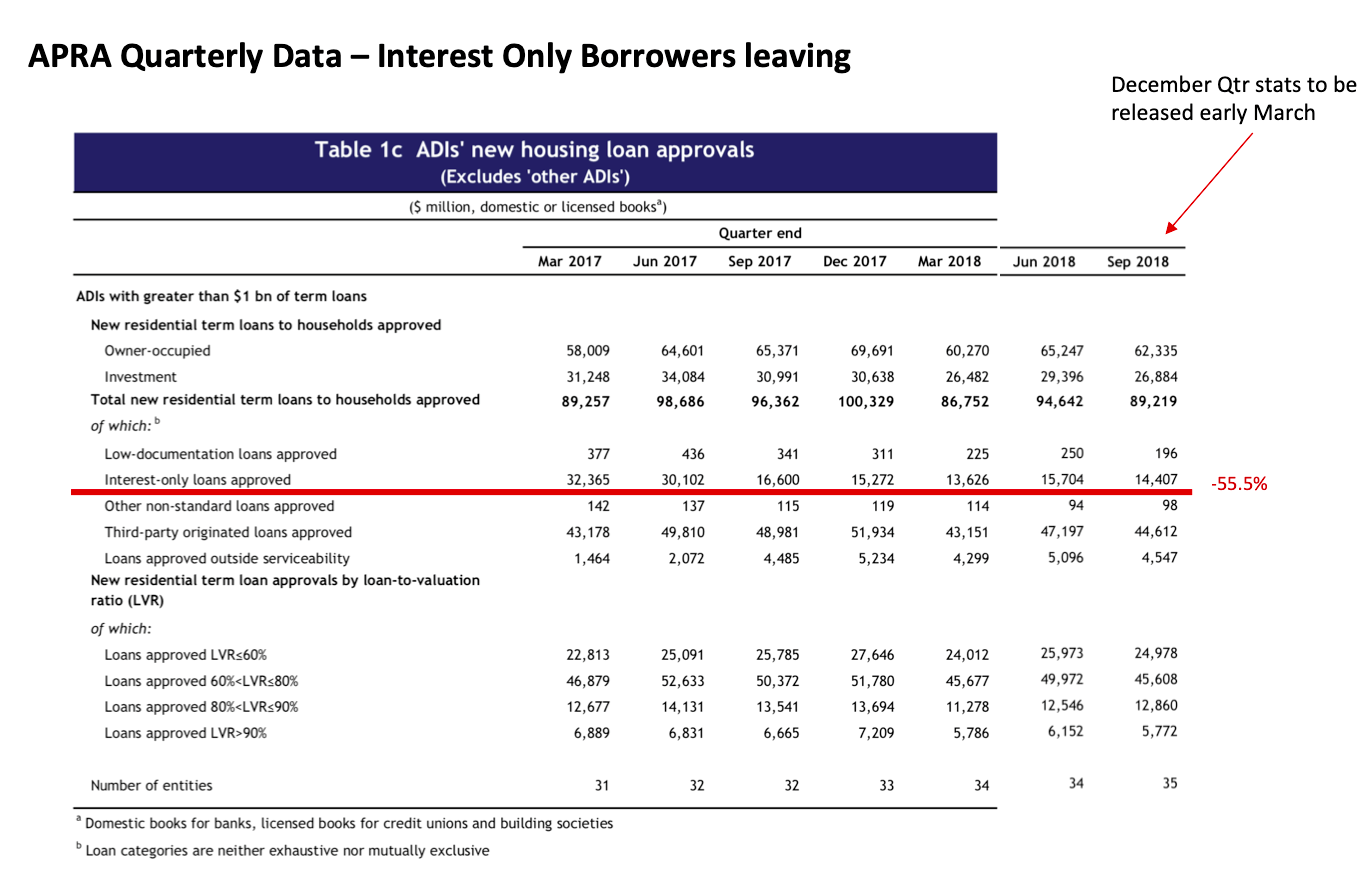
Chart 1: Interest Only borrowers more than HALVED
In this first table, which comes from APRA, you can see that way back in March, 2017, the banks were writing about 33 billion dollars' worth of mortgages in a quarter. Fast forward to the September quarter of 2018, and you can see that that number had dropped to 14.4 billion dollars.
(If the script is too small, click here to access these tables and charts in full size).
That's a decline of almost 56%, and this is for interest-only loans which is the type of loan that investors take out, so it shows that a large portion of domestic buyers have been removed from the buying pool for property in Australia.
Chart 2: Foreign buyers have mostly disappeared
Now, if we turn to foreign buyers and look at this second chart, you can see that Foreign Investment Review Board approved investment in housing has declined precipitously as well. In fact, back in '15-'16, about 72 billion dollars' worth of investment in housing was approved by FIRB, and in '16-'17 that had fallen to 25 billion dollars, but last year, the number was just 12 billion dollars.
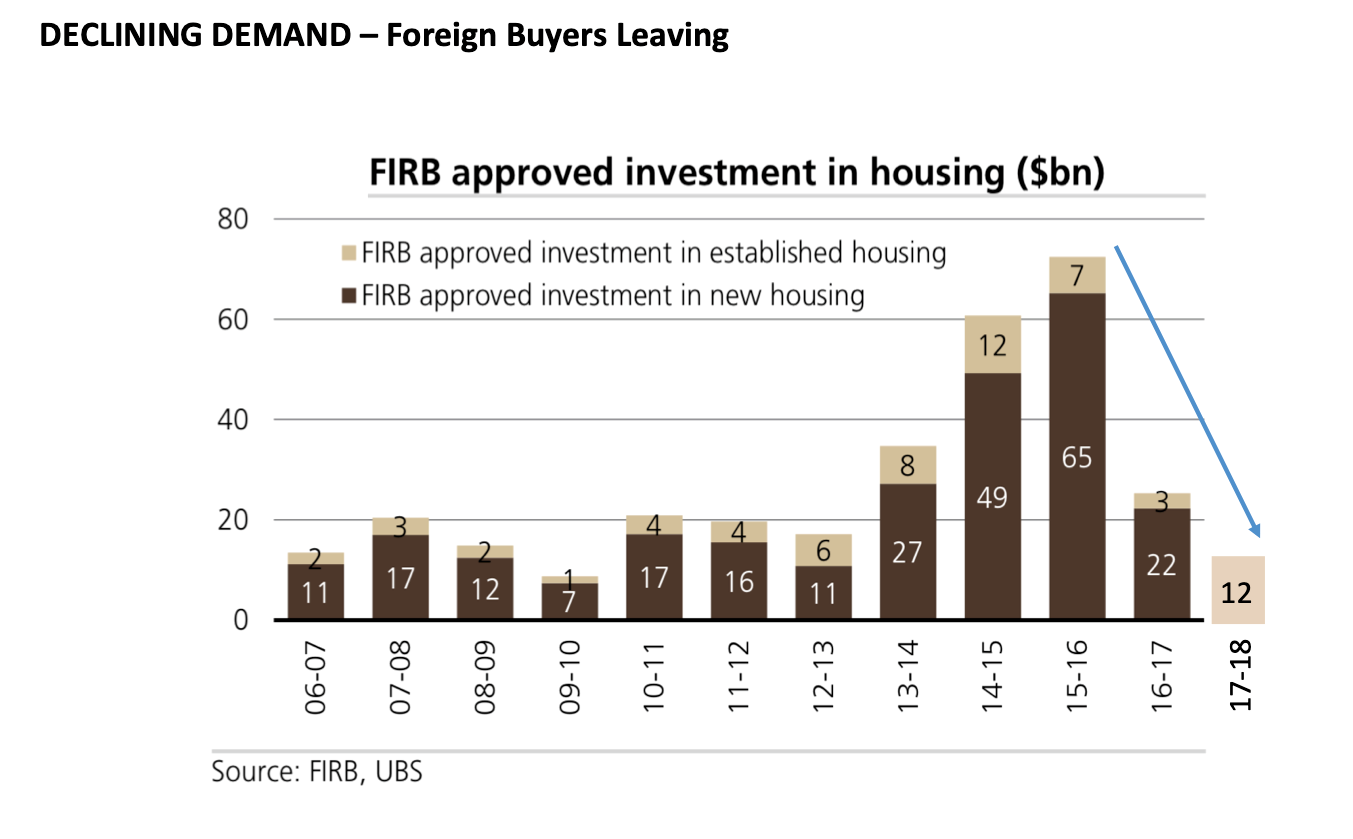
So that means that the foreign buyer has also exited from the Australian market, and by the way, that's not unique to Australia. We're seeing that everywhere in the world at the moment.
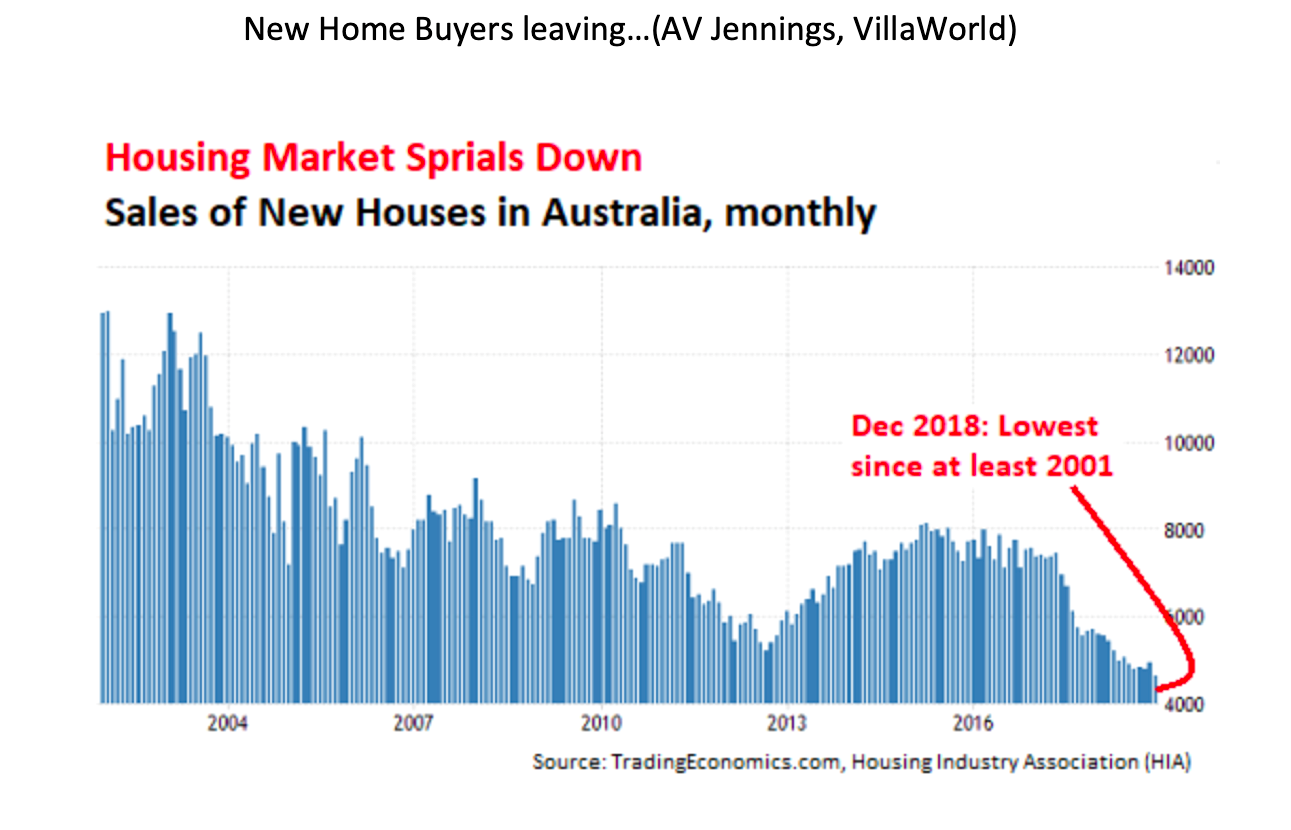
Chart 3: First home buyers evaporated
Turning back to another section of the domestic buying pool, first-home buyers. First-home buyers often buy project homes, not always, but often, and we can see from this data here, new home sales have declined precipitously as well. In fact, we're now at 17-year lows. We haven't seen such a low level of new houses in Australia sold on a monthly basis since 2001.
So a large portion of the domestic buyer has completely evaporated and the foreign buyer has evaporated.
It suggests that we haven't seen a bottom in house prices. That means that it's likely house prices will fall further, that properties will remain listed for longer, and unless someone is forced to sell, we might find people deferring the sale of their property until a better time, whenever that is.
Chart 4: Decline in building activity is yet to come
But now we turn to something perhaps more pressing, and that is whether or not there's going to be forced sellers and what the impact might be on the retail sector. This chart here from Macquarie Research shows the correlation between building approvals and dwelling starts.
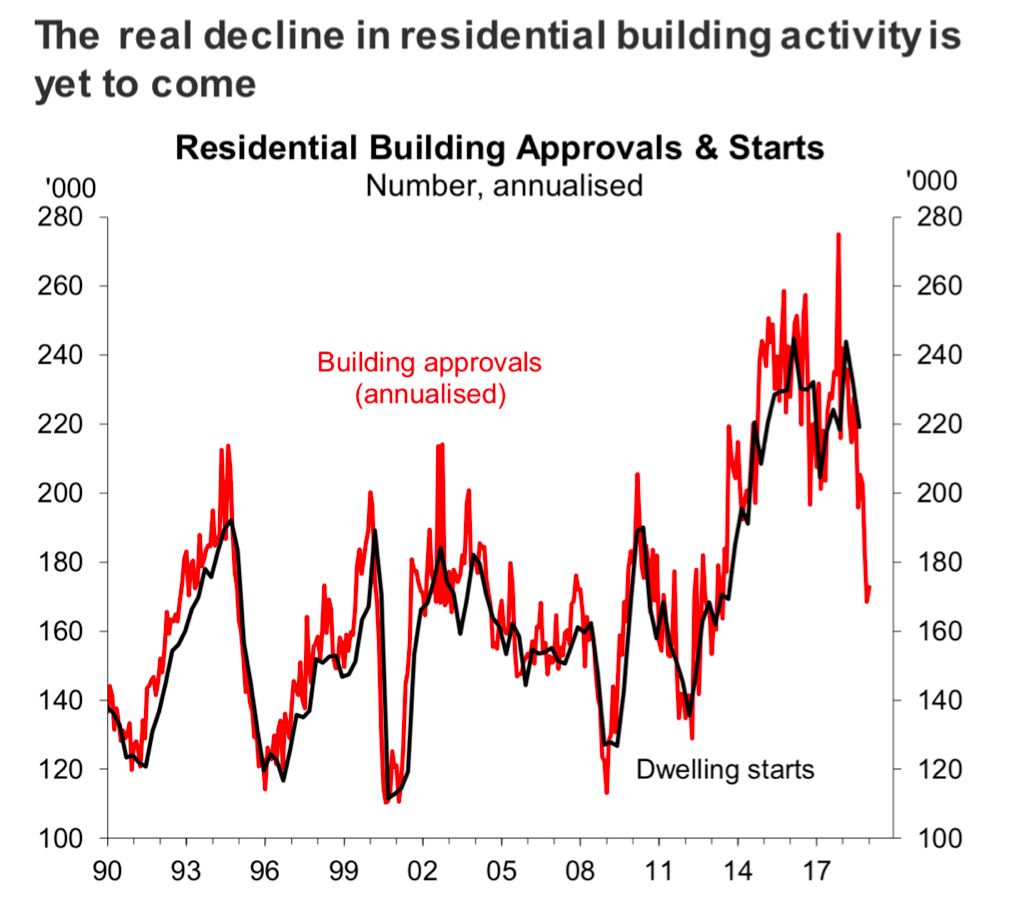
Obviously, you can't build something until it's been approved, so you see approval first followed by construction commencing, and you can see that in the next few months, we're going to see a substantial drop in dwelling starts. Now, a large part of this drop is due to high-rise dwellings, and I think we're going to see, there's probably maybe a 10-month lag between approvals and construction commencing for high-rise development or high-density development.
What does this mean? Well, it means that income for tradies, income for the building industry is going to go down over the course of the next 12 months, and about 37% of the construction industry is in the residential building sector, and that means less income for tradies.
What are they going to be spending money on? Well, presumably they're going to focus on their mortgages. Remember, we've got record high levels of household debt to income and household debt to GDP in Australia. In fact, retail sales are already turning down, even though we haven't seen the worst of the falls in construction activity yet.
Chart 5: Retail sales rolling over already
On this final table, if we concentrate on the furniture and electrical goods part of the retail sales numbers for January, you can see that as early as October last year they were still growing, but fast forward now to January, and you can see they've turned lower and it is accelerating to the downside.
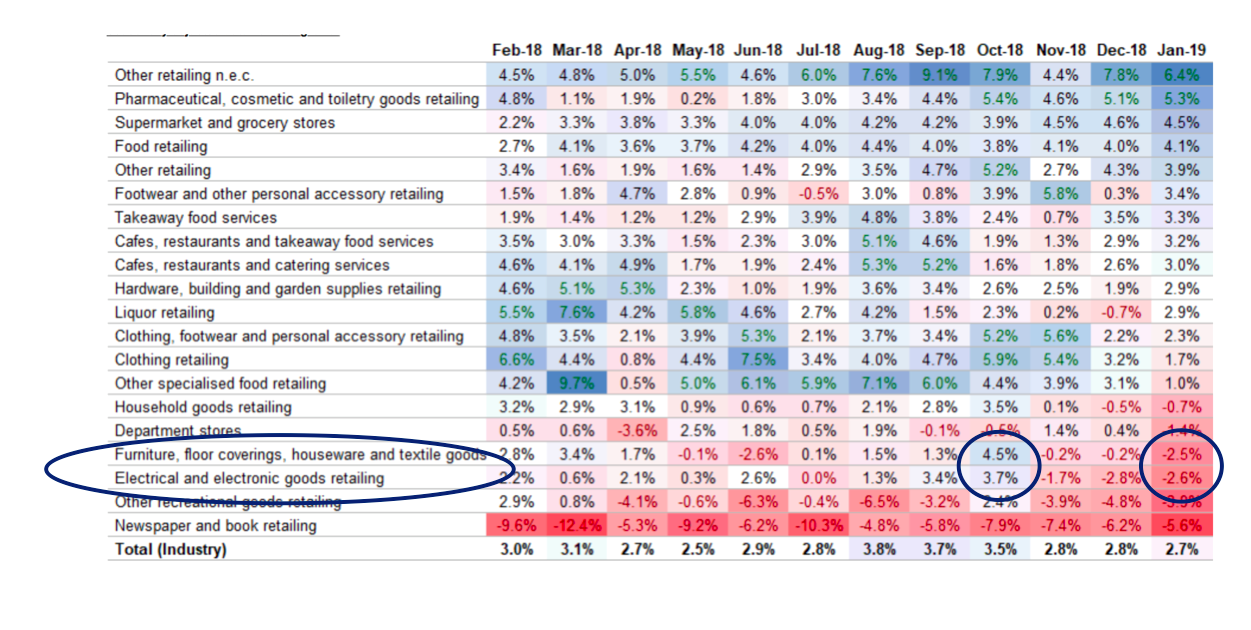
I don't think we've seen the worst in retail sales yet. I think there's more to come for the reasons I've just described. House price falls simply mean people will focus on their mortgages rather than spending money externally, and with less building activity, it's going to put pressure on the budgets and balance sheets of some employees. It may even put pressure on jobs.
Never miss an update
Enjoy this wire? Hit the ‘like’ button to let us know.
Stay up to date with my current content by
following me below and you’ll be notified every time I post a wire
Roger Montgomery founded Montgomery Investment Management in 2010. Roger has more than three decades of experience in investing, financial markets and analysis. Roger also authored the best-selling investment book, Value.able.

4 topics

Roger Montgomery founded Montgomery Investment Management in 2010. Roger has more than three decades of experience in investing, financial markets and analysis. Roger also authored the best-selling investment book, Value.able.
Expertise
Roger Montgomery founded Montgomery Investment Management in 2010. Roger has more than three decades of experience in investing, financial markets and analysis. Roger also authored the best-selling investment book, Value.able.
Expertise
Comments
Comments
Sign In or Join Free to comment