TOL - 16th May, 2025
How Trump’s about-face on tariffs means fewer RBA rate cuts ahead
Shares are up, but expectations for rate cuts are down. How Trump’s about-face on tariffs just slashed RBA rate cut probabilities.
Do you want the good news or the bad news? That old chestnut. What do you usually go for first, the good or the bad? Well, we already know the good news. The USA and China have backed down from the precipice of a damaging bilateral trade war that threatened to plunge both countries – and given they’re the two biggest economies in the world – the rest of us, into a protracted economic slowdown.
Quite rightly, share markets around the world have rejoiced as a result, piling on the gains. Well, more specifically in the case of most stock markets, further recouping the losses triggered by the whole trade war fiasco in the first place. Thanks President Trump!
What you might not know is that with the good news that stocks are closing in on their pre-correction highs (see chart below of the S&P/ASX 200 Index), interest rate markets are also on the rise – and this could be very bad news for mortgage holders.

Unfortunately, this is the common yin and yang of financial markets. When things are looking dicey for the global economy, and stock markets are probably falling out of bed, the great balancer is that market interest rates are probably on the way down too. This is because investors will start to bid up the price of bonds – generally considered a safe-haven asset compared to stocks – plus increase their bets central banks will be forced to cut interest rates to drag economies out of recession.
The first item, buying bonds, tends to push bond prices higher, and due to the inverse relationship between bond prices and bond yields, it means bond yields fall. When enough of them move lower, market yields fall, and this makes it easier for your bank to get cheap funding and provide you with lower mortgage rates. So too does the central bank cutting official interest rates, that would be the Reserve Bank of Australia (RBA) in our case.

The opposite is also true, however. When things aren’t expected to be so bad, investors will sell those safe-haven bonds, driving up market yields, and central banks are less likely to need to cut rates to save their economies. That’s exactly what happened this week. Let’s investigate how share investors’ gains are likely to flow through to increased mortgage holders’ pain.
The implied yield curve
The “implied yield curve” sounds fancy and complicated, but it’s actually a very simple and very helpful tool for mortgage holders to check where the RBA’s official cash rate is likely to be over the next 18-months. Its official name is the “ASX 30 Day Interbank Cash Rate Futures Implied Yield Curve”, and it’s updated daily by the ASX (You can access it here).

The vertical blue bars represent where the short term interest rate market is pricing the RBA’s official cash rate is going to be at the end of each month between now and October 2026, i.e., 18 months into the future. The light blue horizontal dashed line represents the current RBA cash rate of 4.10%. As you can see, the vertical bars show the market is pricing in RBA rate cuts, with May’s bar showing 4.0%, June’s bar showing 3.835%, and so on.
We can do a little math to work out monthly rate cut probabilities. For this month (remember there’s an RBA meeting 19-20 May), the market believes there’s a 40% chance of a 0.25% cut to the official cash rate (4.10% - 4.00% = 0.10%; 0.10% / 0.25 % = 40%). The first month that has a 100% or greater probability of a 0.25% cut is June (4.10% - 3.835% = 0.265%; 0.265% / 0.25% = 106%).
Now, the RBA doesn’t have a meeting scheduled for June, the next is in July – so we can interpret this as the market is warm on a rate cut this month, but should that not be the case, then a cut by July is a lock. In fact, given July’s implied yield is 3.765%, the market is pricing a 34% chance of two 0.25% cuts across the next two meetings.
The likelihood of that second 0.25% cut grows to 92% by the August RBA meeting, and becomes a lock by the September meeting. In all, the market is pricing as much as 0.925% worth of cuts over the next 18 months – so nearly four 0.25% cuts in total.
How Trump’s about-face on tariffs just jacked up your mortgage repayments
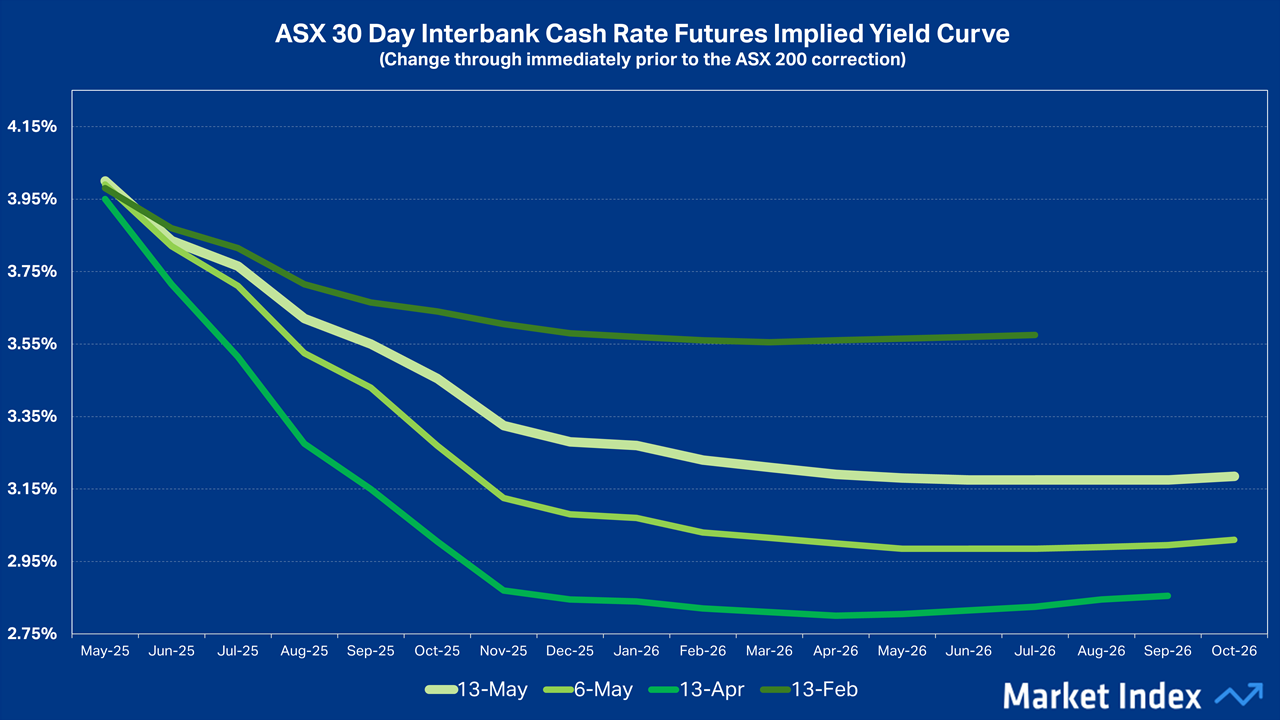
Unfortunately, the ASX only provides a snapshot of the implied yield curve each day, so you can’t really see how it has changed over time. Fortunately, I maintain my own database of implied yield curve data, and therefore, I can do just that! See below how the implied yield curve has changed over the last few months.

The light green and boldest line shows the current implied yield curve. Implied yield curves for -1 week, -1 month, and before the correction in the ASX 200 started back in February, are shown by the other lines from lighter to darker respectively.
We can see that the market’s view of the RBA’s near-term interest rate policy has changed significantly over the past few months as markets have been rocked by the biggest threat to global economic growth since the COVID-19 pandemic. As we would expect, as economic uncertainty grew, the market’s belief the RBA would be forced into defending the Australian economy also grew. This is demonstrated by the massive plunge in the implied yield curve between February and April, indicating a far more aggressive cutting schedule.
Similarly, with positive news events such as President Trump’s pausing of reciprocal tariffs on ex-China countries in early April, and this week with both the USA and China pausing their tit-for-tat reciprocal tariffs, the yield curve has moved progressively higher since the April nadir.
It’s worth noting that at that nadir – the market was forecasting the RBA to slash its official cash rate by 125 basis points by the end of the year. That’s since pared back to 82 basis points, so let’s say 5 typical rate cuts versus now just 3.
Yin and yang but probably for the better
So, in keeping with the yin and yang of markets, it appears the rally in the stock market has come at the cost of fewer impending interest rate cuts than previously predicted. The other thing to consider, is that for most people, the prospect of 5 rate cuts versus just 3 by the end of the year is a happy tradeoff when one considers the former scenario would probably have corresponded with a deep recession.
We’re better off for the fact the market is now expecting fewer interest rate cuts, because both share investors or mortgage holders would be big losers in the event of a recession.
One could even argue that with shares again approaching record levels, and with the prospect of some very decent interest rate relief still on the horizon, we may have achieved somewhat of a Goldilocks outcome. Keep in mind however, the environment that shapes both stock prices and interest rate expectations remains dynamic – they can and will continue to evolve.
At least you’ve now got a handy new tool to track the market’s interest rate expectations – the trusty implied yield curve!
This article first appeared on Market Index on Wednesday 14 May, 2025.
Never miss an update
Enjoy this wire? Hit the ‘like’ button to let us know.
Stay up to date with my current content by
following me below and you’ll be notified every time I post a wire
Carl has over 30-years investing experience and has helped investors navigate several bull and bear markets over this time. He is a well respected markets commentator who specialises in how the global macro impacts Australian and US equities. Carl has a passion for technical analysis and has taught his unique brand of price-action trend following to thousands of Aussie investors.
........
Investing is risky. Inevitably you will endure losses. If you can't cope with losing, don't invest.

5 topics
11 stocks mentioned

Carl has over 30-years investing experience and has helped investors navigate several bull and bear markets over this time. He is a well respected markets commentator who specialises in how the global macro impacts Australian and US equities. Carl...
Carl has over 30-years investing experience and has helped investors navigate several bull and bear markets over this time. He is a well respected markets commentator who specialises in how the global macro impacts Australian and US equities. Carl...
Comments
Comments
Sign In or Join Free to comment