13 charts that show just how insane monetary policy really is
Someone (maybe it was Albert Einstein) once opined that: “Insanity Is Doing the Same Thing Over and Over Again and Expecting Different Results”
It is our view that the maintenance of negative rates of interest across both Europe and Japan with no positive economic result, is an act of economic insanity. Further the continuation of quantitative easing for nearly 8 years (in Europe) and over 15 years (in Japan) with no discernible economic benefit are also acts of economic madness.
What will it take for the central bankers of Europe and Japan to realise that their management of monetary policy is not working and that there is no proof that it can work? Surely, they can see that negative cash rates do not stimulate or even hold economic growth?
The recent readings of declining economic activity across Europe and most notably in Germany, reflect poorly on the excessive use of monetary stimulation. Further, the declining business confidence in Japan recorded in February is a replay of many prior poor readings. Negative interest rates have done nothing to stimulate business confidence.
Our conclusion is this....
The central bankers and bureaucrats of Europe and Japan are bereft of new ideas that will stimulate their economies. In our view they seem totally deluded in the belief that they are doing a good job. Rather they are seemingly repeating the same mistakes. Their policies have previously and once again taken their economies towards stagnation.
Today they have no more ammunition – short of printing money and giving it to the public - to stimulate economic activity and business confidence.
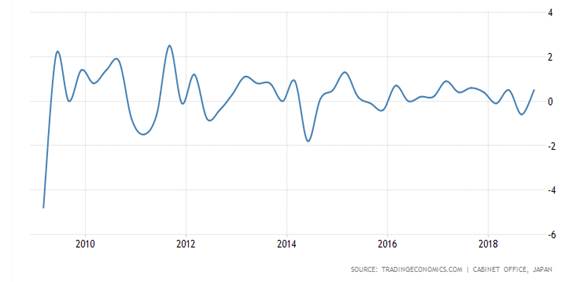
Japanese economic growth over the last ten years is represented in our first chart. Throughout this period Japan was effectively full throttle with monetary policy.
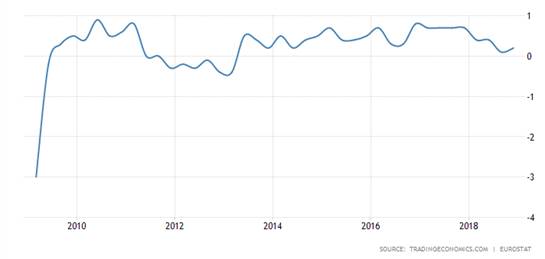
Eurozone growth is hardly much better, and it has had its foot to the floor with both QE and zero interest rates.
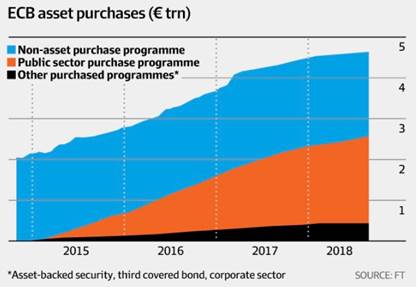
These feeble growth outcomes follow years of aggressive monetary policy. The next chart tracks the growth of the European Central Bank balance sheet (QE) that has grown by over 2.8 trillion euros over the last 4 years.
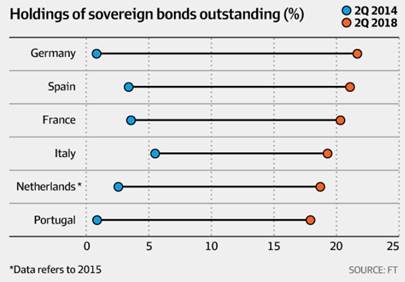
The purchase and the holdings of government bonds have ballooned. Across most of the individual economies in the Eurozone the ECB holds over 20% of all bonds on issue and in reviewing the purchases, there seems to be little logic to the process. For instance, the acquisition of German bonds seems inconsistent with the need to finance the German government given its fiscal position is very strong. So why is the ECB holding of German bonds the same as for Italy or Portugal, which are economies in a fiscal mess?
It seems that the Germans, who effectively run the ECB, believe that the likes of Italy or Portugal should receive no preferential treatment, even if they are in dire need and Germany is not!
The maintenance of zero and negative cash rates since 2012 is shown on our next chart. While the US has tried desperately to normalise rates, the Europeans and Japanese have gone the other way – further into negative.
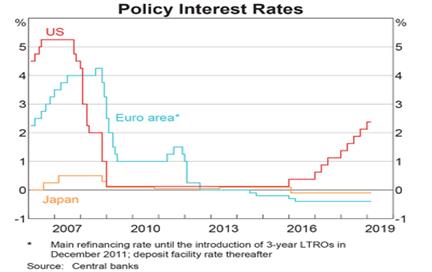
The policy of negative cash rates is designed to penalise banks for not lending. The excess reserves (or liquidity) of banks must be deposited with the central bank and therefore are effectively taxed by negative interest rates. To stop their loss the banks can push credit out, but with no inflation, no business confidence and no perceived growth, there is little demand for credit.
The negative cash rates do stimulate demand for government bonds as banks in particular seek yield from other sources. The maintenance of negative cash yields combined with QE has pushed government bond yields into negative territory and so the banks are stymied here as well. No wonder the profits of the European banks is dreadful and the two largest German banks (Deutsche Bank and Commerzbank) are now trying to merge to drive costs down.
Our next chart (as at December 2018) tracks the amount of government bonds that trade in markets with negative yields. It shows that at that time 64% of all Japanese bonds on issue had a negative yield - even though Japanese ten year bonds were yielding a positive return. Since December, Japanese ten year bonds have fallen below a zero yield and the percentage of negative yielding bonds has lurched higher towards 70%.
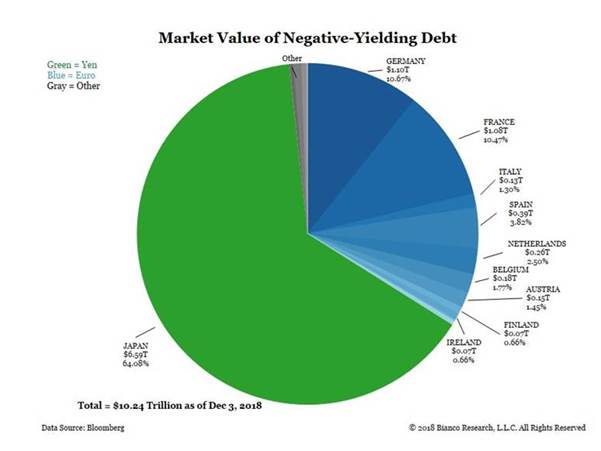
The cost to the economies and the investors of Europe and Japan is immense. It is the savers and providers of capital that suffer most. The destruction of the capital of pension funds must surely be a hidden time bomb.
How can pension funds that generate little or no return meet the liabilities of an ageing population?
How significant is the pension shortfall across Europe and Japan? We can only wonder.
But if there is a grand covert plan to recapitalise Europe and Japan through QE - it could be this. The central banks buy all of the government debt on issue and then write it off or roll it into 100 year bonds. The debt will never be repaid and effectively disappears! There is no other logical explanation for what is happening in Europe and Japan – other than insanity!
Unfortunately, it is the policies of central bankers in Europe and Japan that is affecting the growth outlook for the whole world. It is their policies that have stymied the US monetary policy adjustment that is now on hold. It is their policies that are increasingly influencing the investment returns of Australian retirees.
The outlook for Australian asset classes
There is no doubt that the declining and manipulated bond yields of Europe and Japan directly influence the bond yields in the US and therefore Australia. However over recent months the interplay between US and Australian bonds has passed through a significant and historic point.
As can be seen from the chart below, the Australian ten year bond has dipped below the US bond yield and has continued to do so.
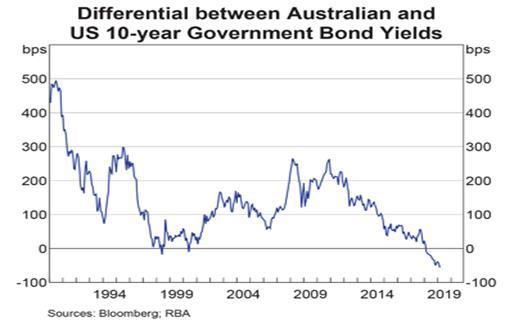
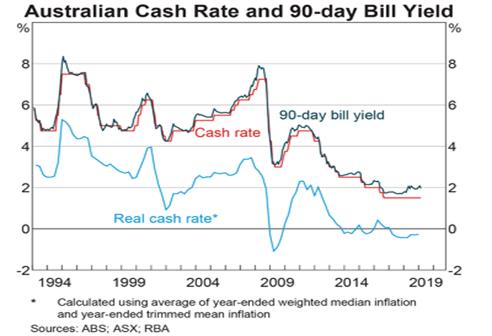
The Australian bond yield lurched lower this week to a record low that is now 0.25% below the RBA targeted rate of inflation. Thus ten year bonds are close to having a negative “real” yield.
The RBA inflation target, which does influence the expected return from investment assets, remains unmet. The recent reading of inflation at about 1.5% is well below the target range of 2% to 3%.

Thus, the RBA is hamstrung by both the low inflation rate and the influences from offshore policy settings. We predict that Australian cash rates will remain at current levels for at least another 12 months.
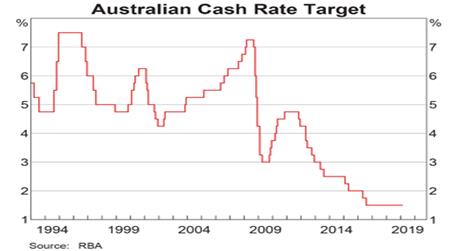
Australia currently has “negative” real cash rates which are feeding into bank bill rates and thus the term deposit rates offered to SMSFs by banks. The outlook for term deposit rates is depressing!
A source of yield has been the Australian equity market. The grossed-up yield (with the benefit of franking credits) has averaged around 6% and given SMSF investors a yield that compensates for the appalling alternatives of bank deposits and government bonds. Therefore, the policy of the ALP to stop franked cash rebates would make yield investing even more difficult in an historically low yield market.

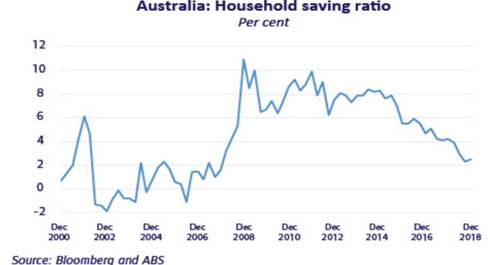
Low investment returns on savings and cash deposits in SMSFs is having an effect on the savings ratio. These negative influences have added to stagnant wages growth (below inflation) and the rising cost of basic public services to push Australia’s savings rate down. Normally a declining savings ratio indicates growing consumption and consumer confidence – but not this time.
This analysis supports our view that the outlook for investment returns is unexciting. Low growth, low inflation and low interest rates (short and long term) all suggest that investors need to adjust downwards their outlook for investment returns – from all asset classes. We continue to recommend that SMSFs target yield in the management of their portfolios before it is too late.
A
Finally, in a most disturbing development, our last chart shows that Australian business confidence is waning. While many commentators track the investment intentions of business to determine the outlook for growth, we are more interested in actual investment.
The chart below from the RBA shows that Australian listed companies dramatically reduced capital raisings in 2018. Indeed the non-financial sector actually reduced capital employed (it returned capital to shareholders) for the first time in over twenty years.
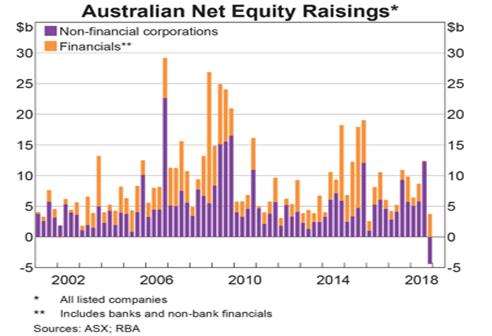
Thus, if Australian companies are finding it difficult to justify investment of their capital, with no need to raise more, then why would investors in the Australian market believe that they can?
The emphasis for investment in equities in Australia must be tilted towards smaller companies and those focused on offshore markets (mainly emerging Asia and US).
It remains a difficult climate for investing. SMSFs must remain disciplined and diversified. They should not be driven by greed to chase excessive returns that are high risk.
Not in a world driven by insane monetary management.
Never miss an update
Enjoy this wire? Hit the ‘like’ button to let us know.
Stay up to date with my current content by
following me below and you’ll be notified every time I post a wire
John has 35 years experience in funds management and corporate advisory services. Prior to establishing Clime, John’s roles included ten years at NRMA Investments as the head of equities.
Clime is a management and advisory business for mainly SMSFs.

5 topics

John has 35 years experience in funds management and corporate advisory services. Prior to establishing Clime, John’s roles included ten years at NRMA Investments as the head of equities. Clime is a management and advisory business for mainly SMSFs.
John has 35 years experience in funds management and corporate advisory services. Prior to establishing Clime, John’s roles included ten years at NRMA Investments as the head of equities. Clime is a management and advisory business for mainly SMSFs.
Comments
Comments
Sign In or Join Free to comment