Is US dollar volatility a little too quiet?
Implied volatility is a well known indicator for the stock market e.g. the CBOE VIX Index, with spikes and troughs in the index generating useful market timing signals. But what about the foreign exchange markets? Today's chart shows the average US Dollar option volatilities across developed market currencies, and the interesting thing is that it has sharply contracted.
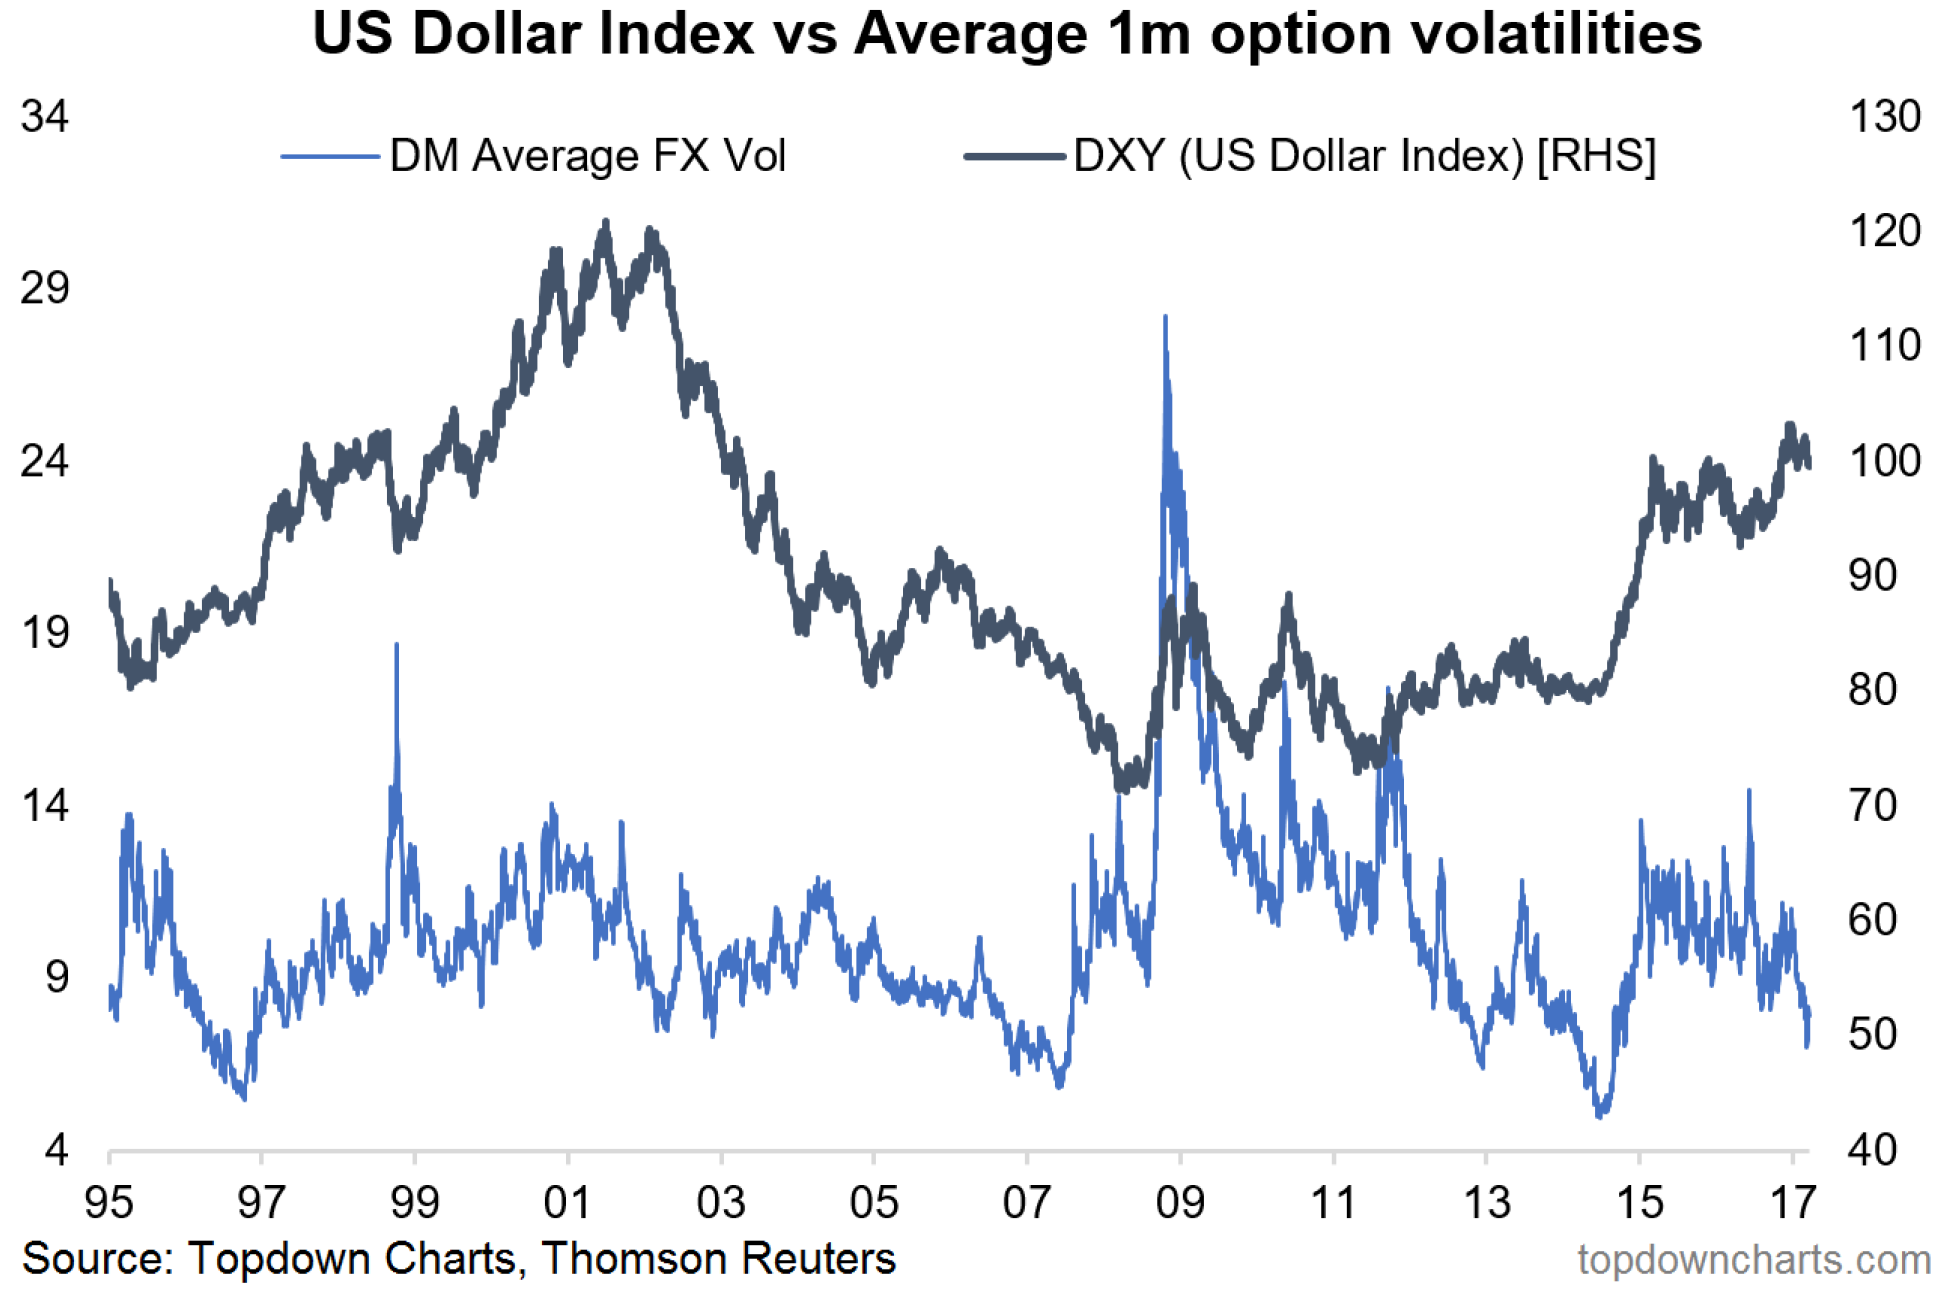
In comparing the indicator to the US Dollar Index, it's not necessarily a case of high vol means a bottom or low vol means a top. If anything, it seems that high vol is usually seen at the end of a move and low vol at the start of a move. And since the indicator is at the low end that means we could be about to see the start of the next big move...
Never miss an update
Enjoy this wire? Hit the ‘like’ button to let us know.
Stay up to date with my current content by
following me below and you’ll be notified every time I post a wire
Callum is Head of Research at Topdown Charts.
Topdown Charts is a chart-driven macro research house covering global Asset Allocation and Economics.

4 topics

Callum is Head of Research at Topdown Charts. Topdown Charts is a chart-driven macro research house covering global Asset Allocation and Economics.
Expertise
Callum is Head of Research at Topdown Charts. Topdown Charts is a chart-driven macro research house covering global Asset Allocation and Economics.
Expertise
Comments
Comments
Sign In or Join Free to comment