A roadmap for Australian investors in the global market

Geoff Wood
2018 has been a fascinating year so far with many different cross-currents running through markets. We have seen central banks hiking, just as Governments look to expand fiscally. At the same time, the big economic powerhouses go head-to-head on trade. Where does this all lead us? Below we walk through our current framework as Australian investors in the global markets.
Are we nearly there yet?
The question: “Are we nearly there yet” is probably most famously asked by children on a long car journey. The second group most likely to ask this question are equity investors as we move through the cycle of markets.
The US equity market is in its second longest period of expansion since the 1930s. At over 100 months of expansion, it naturally leads to the question of when this will end.
We believe the best single indicator for the end of the cycle is to be found in bond market pricing, and in particular the shape of the yield curve. There is much in the press about the yield curve flattening or even “inverting”, which means short-term interest rates are rising relative to long-term rates. While we believe these statements have some merit, the devil is in the details. Yield curves can flatten and even be inverted for years.
The real red flag is when the curve starts to steepen after this period. In particular when the curve steepens, as short-term interest rate expectations start to fall relative to long term. You can see how this has played out in previous market highs in the chart below, which highlights the S&P 500 (in orange), versus the steepness of the yield curve, as measured by 30-year minus 5-year yields (in white). Intuitively, the bond market is going from pricing hikes to an increasing chance of interest rate cuts – i.e. a recession on the horizon.
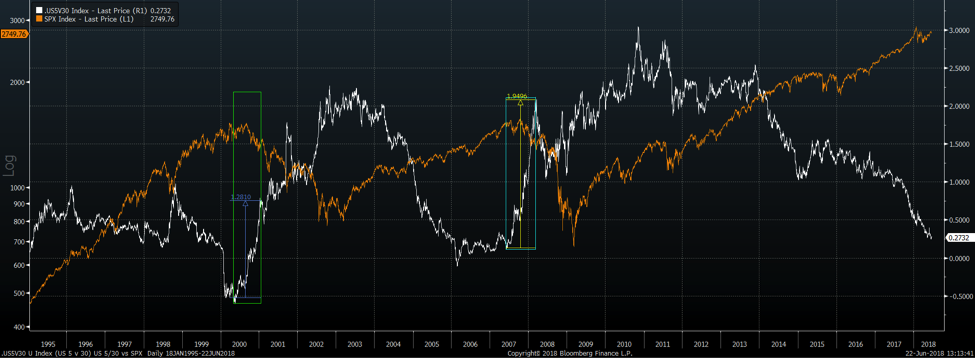
Source: Bloomberg
- May 2000 was the low point for the 5/30 spread. Over the next 7 months to the start of 2001, the curve had steepened by 100bps, completely breaking its flattening trend. This period marked the top in markets. From the start of 2001, the equity market fell by 40%.
- In June 2007, the curve steepened by nearly 200bps over the following 9 months and again this coincided with the top in the equity market. From March 2008, the market fell by over 40%.
So where are we now?
Right now, we are still in the flattening process and until we start to see the curve steepen materially then the bond market continues to say: “No. We are not there yet”, and the equity market expansion should continue.
Which sectors tend to do well at this stage?
With history as a guide, and again using the shape of the yield curve as a quantitative prism to view the stage of the cycle, we can see which sectors typically do well during these times.
- US Sector Performance Relative to Market 1985-2008
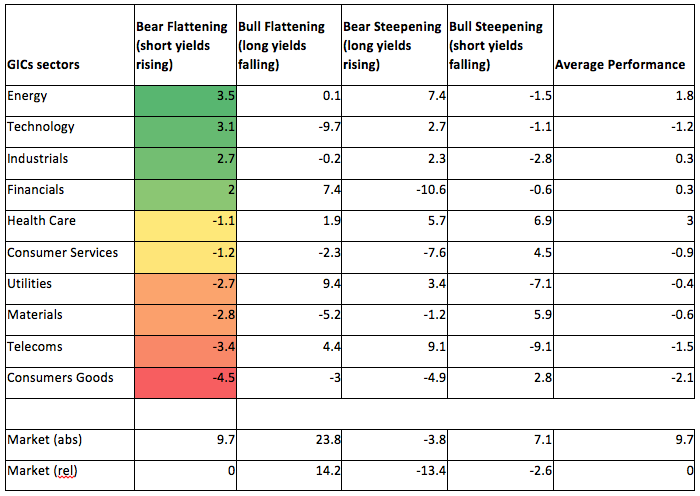
Source: Minack Advisors
- The first column, “Bear flattening”, is where we currently live as short-term yields are rising in the US. This tends to be a good period for markets and particularly the more cyclical sectors such as Technology, Energy and Financials, while the defensives such as Utilities and Consumer Goods underperform.
Where’s the Fed Put?
While we remain constructive medium-term, we always like to ask ourselves “What does wrong look like”. If things deteriorate, where can global stock market prices fall to?
An important input in this debate is how far will the equity market have to fall before the US Federal Reserve sit up and pay attention and work to allay market fears. In market speak, this is often referred to as the “Fed Put” which refers to a Put option which provides protection in a falling market.
These were the comments the incoming Fed Governor Jerome Powell made in February, a few weeks after the market had fallen more than 10% in the space of 2 weeks:
"Despite the recent volatility, financial conditions remain accommodative. At the same time, inflation remains below our 2 percent longer-run objective. In the FOMC's view, further gradual increases in the federal funds rate will best promote attainment of both of our objectives."
This was a strong mark of confidence from the Federal Reserve: it shows that they were going to ignore the stock market and keep hiking.
The implications for market participants is that one needs to be prepared to expect more volatility, i.e. larger swings in market prices going forward. The popular strategy of buying all 5% sell-offs in markets now comes with more risk than under the Janet Yellen Fed.
Do Politics Matter?
After many years of being able to ignore politics in developed markets, Brexit marked a watershed moment whereby Politics began to matter again. As an example, the 10% fall in the British Pound post-Brexit has not been recovered.
Markets since Brexit have continued to demonstrate a lack of proficiency in pricing political risk. The Trump result was unexpected but even once it was known, stocks have struggled to price what it meant. Taxes and tariffs were well flagged by Trump, but the market has tended to allocate too low a probability to them actually occurring – the old mentality of ignoring politics has been too prevalent.
One needs to acknowledge this added complexity but also recognise the new opportunity set. More emphasis needs to be put on reacting to changes in global policy direction rather than ignoring them as one could have in the past.
What’s the direction for the Australian Dollar?
As a global investor based in Australia, it is important to have a view on the Australian Dollar. Our investors benefit as the currency weakens and vice versa.
We believe the medium-term trend continues to be lower for the Aussie Dollar and it is best summed up with the below chart from the Reserve Bank of Australia (RBA):
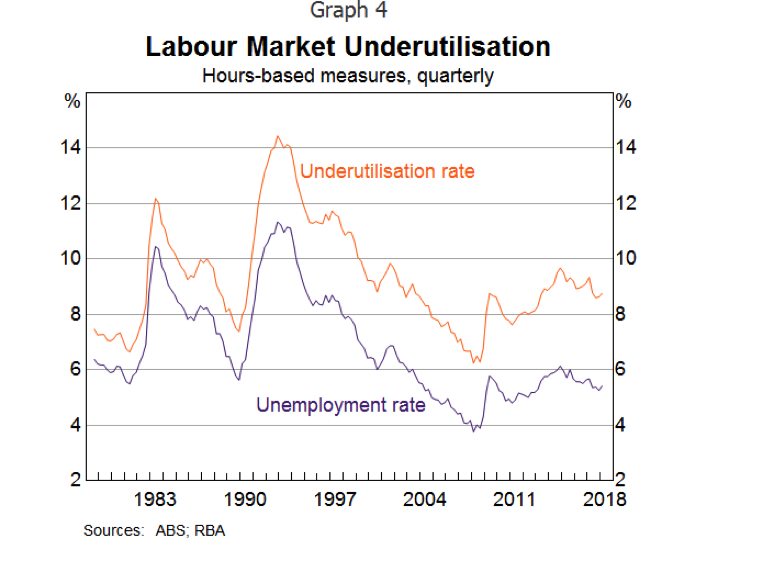
Underutilisation in the labour market - also known as slack - continues to be significant. This means that there are many people that are either unemployed or not working the number of hours they would wish to. It will take time for the economy to absorb and create opportunities to reduce this. The RBA is focussed on this metric and is unlikely to raise rates until there has been significant improvement.
As such, with the RBA on hold for the foreseeable future, the currency will likely weaken over the medium-term to assist in moving the economy forward.
In summary: Our 5-point framework for global markets today
Global markets have more room to run, with Financials, Technology and Energy candidates to lead the rally, and we are keeping an eye on bond markets to signal an end to the expansion.
The path from here is likely to involve wider swings in prices, as the Federal Reserve provides less support. Politics is a relatively new and ongoing source of risk, and opportunity, for markets and one needs to be ready to adapt to changing policy direction.
And, finally, a falling Australian dollar should be a tailwind for global investors over the next few years.
--
Contributed exclusively for Livewire by Geoff Wood, Head of Macro and Risk at Morphic. For more information and additional insights from Morphic Asset Management, please click here.
Never miss an update
Enjoy this wire? Hit the ‘like’ button to let us know.
Stay up to date with my current content by
following me below and you’ll be notified every time I post a wire
By
Geoff Wood,
Geoff joined Morphic at the inception in 2012. Before joining Morphic, he worked in risk management at Global Trading Strategies, as well as Barclays Capital in London. Geoff holds a M.Sc Financial Engineering and Computer Science.

8 topics
Geoff Wood
Geoff joined Morphic at the inception in 2012. Before joining Morphic, he worked in risk management at Global Trading Strategies, as well as Barclays Capital in London. Geoff holds a M.Sc Financial Engineering and Computer Science.
Expertise
Geoff Wood
Geoff joined Morphic at the inception in 2012. Before joining Morphic, he worked in risk management at Global Trading Strategies, as well as Barclays Capital in London. Geoff holds a M.Sc Financial Engineering and Computer Science.
Expertise
Comments
Comments
Sign In or Join Free to comment