The five charts the experts are watching right now
Bond markets recently slapped equity investors in the face with a 50-basis point reminder of who is really in charge here. As the famous quote from James Carville goes: “I used to think that if there was reincarnation, I wanted to come back as the president or the pope or as a .400 baseball hitter. But now I would like to come back as the bond market… You can intimidate everybody.”
And as they say, you wouldn’t ask a plumber to fix a car. So we reached out to 5 rates market experts for their view, by asking which chart they are following most, and what it is telling them. Read on for exclusive expert insights from Richard Quin, Brett Gillespie, Charlie Jamieson, Simon Doyle and Chris Rands.
No refuge in bonds from falling equities
Richard Quin, Bentham Asset Management
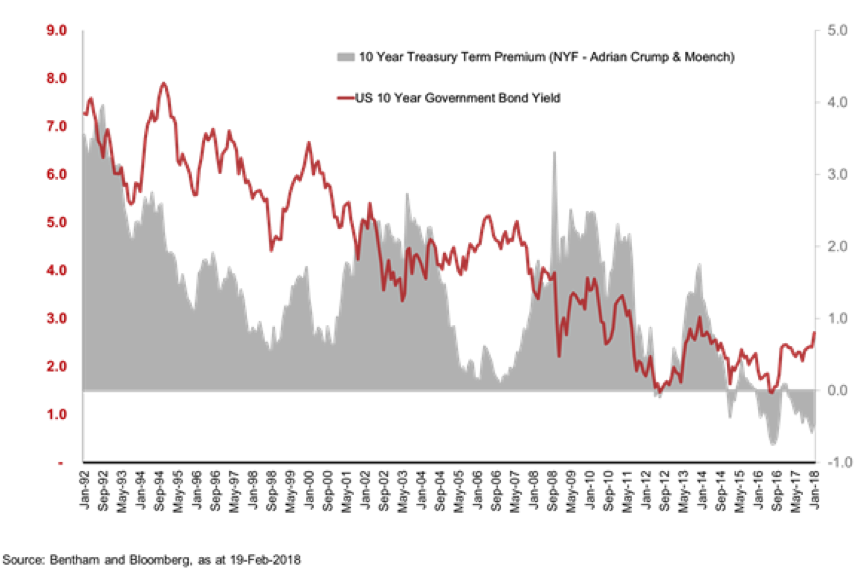
We've been focused on 2yr and 10yr US Treasury yields, and the "term-risk premium" that comes with that, as a symbol of how expensive the government bond market is. The reason it’s important is that it gives you a measure of how much you are being compensated for taking long-term interest rate risk.
Looking historically, the term-risk premium has moved between 4% and -0.85% in the last 25 years but is currently hovering around -0.22%, close to its record lows as the chart below shows.
What does this mean?
In terms of what this means for our portfolios, in short, it is not cheap to buy long-term bonds.
We are not getting enough interest rate yield to buy long-term bonds, and expect to produce positive returns above inflation.
As a consequence, we are not adding interest rate risk to portfolios - we're largely steering clear of long-term fixed-rate government and corporate bonds, favouring investments with floating rate profiles, or achieving that through interest rate derivatives.
Will this normalise?
The current negative level of term risk premium is unusual, and we think it is likely that the Fed’s Quantitative Easing policy has suppressed the term risk premium. As interest rates normalise (with the gradual winding back of QE and a move away from extraordinarily low monetary policy), we would expect the term risk premium to become more positive.
When it does get to +0.50 to 1.00% area, it may indicate that bonds are more investible and capable of generating a positive excess return, and we would be considering adding interest rate risk to portfolios.
Have we seen this before?
The current situation is actually quite unique - unprecedented over the past 25 years, where investors have enjoyed a positive risk premium and a long-running bull market in government bonds.
This is probably what worries us the most for investors – there is probably some complacency out there.
End investors may not realise that past returns and correlations of government bonds are very unlikely to be repeatable or relevant in the current context.
For example, we think it’s a real possibility that Australian / Global Fixed Interest produce negative returns over the next 1, 2 or 3 years. We don’t expect in times of equity market stress (particularly any shakeouts caused by a normalisation of interest rate markets) that long-term fixed income will necessarily provide a positive return to counter those share market losses.
1 in 3 chance of a US recession in 2018
Brett Gillespie, Ellerston Capital
The chart below identifies the points at which higher bond yields have caused a fall of 5% or more in equities.
- The Y-axis identifies how much higher yields were, versus the 3-month average
- The X-axis identifies how many days it has taken for that rise to occur.
We looked at data over the last 30 years. As you can see, the size of the move and how long it has taken is important.
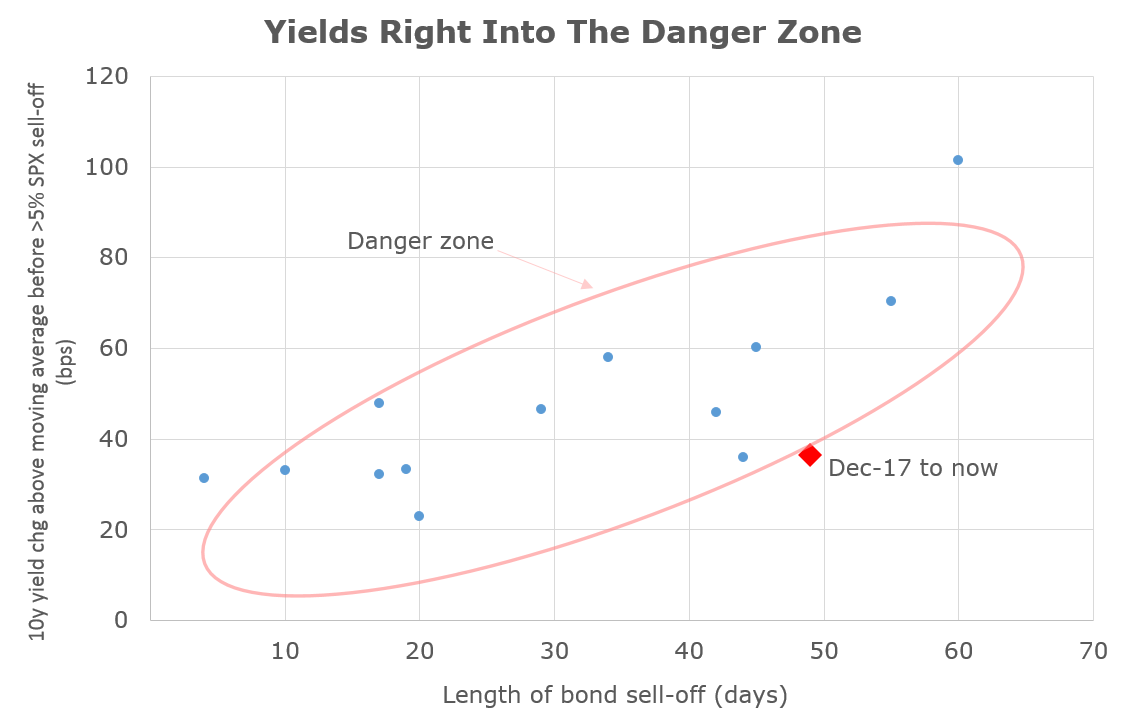
The key takeout from this chart is this: Every time bond yields move into this danger zone this year, we would expect equities to suffer a 5% pullback.
Two ways that rising yields hit equities
There are 2 ways in which rising yields impact on equities. It is important to differentiate the two as they have significantly different outcomes as discussed below.
1: Via the valuation model
Expected futures earnings are discounted by the risk-free interest rate - typically the 10-year bond rate - to determine today’s value. A higher interest rate today reduces the value of future earnings.
So, each time we have a sustained rise in bond yields, future earnings value is reduced, and today's stock price needs to decline, all else equal.
This is what I believe is the happening now, in which case equities will just need to do a valuation adjustment each time it is accepted that 10-year yields are settling into a new higher range.
2: Higher interest rates slow the economy
If rates move too high, they cause a recession. Central banks obviously are careful to avoid this, but pretty much every US recession between WW2 and the dot-com bust in 2000 was caused by the central bank (Fed) raising interest rates.
The economy would overheat, inflation would rise, and the Fed would try to slow the economy. But slowing an economy by just the right amount is inherently difficult, and so invariably the Fed hikes tip the economy into recession.
For equities, it is important to identify which scenario we are dealing with. If we move to scenario 2 above, that means a recession is highly likely.
Equities typically fall anywhere from 20-60% in a recession, depending on how deep it is.Currently, we assign a 33% chance to scenario 2 developing this year.
A sharp acceleration of wages in the US would be the signal that we are moving to scenario 2.
The pivot-point for the post-GFC economy
Simon Doyle, Schroders Australia
The delicate poise of economies and financial markets will pivot on 2 key factors:
- The risk of recession, which for at least the time being seems low.
- Inflation: As evidence accumulates of rising underlying inflation pressure in the US, Europe and Japan. This build-up in inflationary pressure may not appear too problematic at present, but once it does build, it is hard to contain. Early February gave us a glimpse of what could happen.
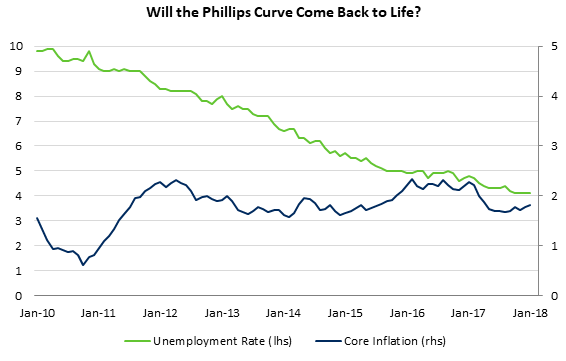
Given this, we believe the relationship between US unemployment and core inflation and wages growth is critical.
Source: Thomson Reuters Datastream
Survey-based wages data is alarming
The inflation “sceptics” argue that the Phillips Curve is badly wounded. They argue that structural change (technology, demographics, globalisation etc) has changed the relationship between unemployment and wages, such that declining unemployment will not translate to higher wages.
While these factors will have an impact, they won’t obviate the directional link between tighter labour markets and wages.
Research by the US Fed itself is consistent with our own research that suggests this relationship still exists, but importantly is “non-linear”. That means it won’t show up until the unemployment rate passes through a threshold (viewed as around 0.5% below the NAIRU - or an unemployment rate of around 4% which is where it is today).
While the hard data in the US suggests wages are slowly rising, softer survey-based data is more alarming, indicating a much stronger rise in wages is possible in the months ahead.
This is critical as the Fed has been able to sit on the sidelines. However, if this trend continues, then we could well be at the pivot point for the post GFC economy.
The liquidity bubble that central banks have built to support economies and asset prices over the last 10 years has been fuelled by the fact that inflation has been suppressed.
Strong growth in the US, including additional unfunded fiscal stimulus, together with ongoing recovery in Europe and Japan has potentially worked off that excess capacity which is causing inflation pressures to rise.
The gap between policy settings and the economy however remains large. A weak US dollar, narrow credit spreads and high equity prices also imply that financial conditions remain very easy.
If inflation pressures continue to build then pressure will revert to central banks to respond. Official rates rising globally and central bank balance sheets shrinking is not something we’ve seen for a while.
The clear parallel for today is the mid-1960’s in the US
Through the early 1960’s the US, the unemployment rate declined significantly from 7% to close to 4% whilst core inflation and wage growth remained benign.
However, once the unemployment rate fell below 4%, wages and core inflation picked up dramatically. Between 1966 and 1970, US core inflation rose to around 6%. To be fair, other things were going on (fiscal stimulus, rising commodity prices) but the trend was firmly up and did not turn up until the unemployment threshold had been breached. While history doesn’t repeat, it does warn us not to take the risk of higher inflation lightly.
It all hangs off the German bond market
Chris Rands, Nikko Asset Management Australia
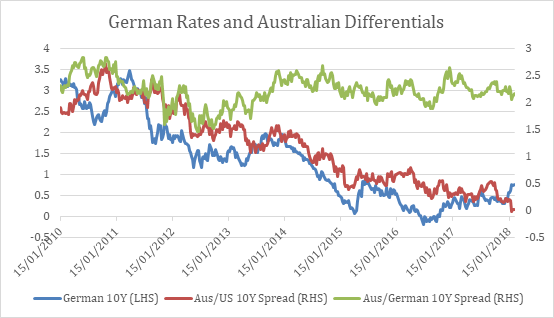
The most important chart to watch for bond investors at the moment is German 10-year yields, which are precariously close to breaking higher in yield.
This can be seen in the chart below where German rates (blue line) have risen to their 2015 highs, but remain approximately 1% below their average 2012–2014 levels.
This is important as interest rates globally have been falling in line with the European moves and will likely rise with them when they sell off.
As an example, the spread between Australian 10-year bonds and German 10-year bonds has been stable at 2.00–2.50% over the past three years (green line), while over the same period Australian 10-year bonds have contracted by almost 1.50% to US 10-year bonds ( red line).
This suggests that Australian rates have been moving in line with German interest rates since 2014, rather than the United States, making the direction of European rates pivotal for how far global bonds can sell off.
A breakthrough of German 10-year rates to their 2013 levels would mean we could see another 100 basis point selloff in global bonds.
Conversely, a sign from the ECB that low rates are here to stay would imply German yields can drag global bonds 25–50 basis points lower by returning to their average of the past two years.
German bonds the key barometer of all-important ECB policy
We have seen this dynamic play out multiple times over the past few years as investors try to time when the Central Banks will end their bond-buying programs.
Typically it has paid to take a sceptical view of interest rates selling off, as Central Banks unveiled larger and larger bond-buying programs to encourage inflation.
Whether or not this is true going forward will depend on how strong the European Economy is and whether the inflationary pulse that can be seen in the US also makes it to Europe.
Without a stronger economy, the ECB will probably continue their bond-buying program and grind yields tighter. This makes the 10-year German yield an important metric to watch on how investors are reading the European situation.
The virus that affects all asset classes
Charlie Jamieson, Jamieson Coote Bonds
We believe investors should consider two critical questions when building their macro market roadmaps:
- At what interest rate does the US Federal Reserve stop hiking funding rates?
- Is the recent uptick in US inflation secular or cyclical?
Are we already at the Fed's target?
Interest rates are the virus that affects all asset classes. So, forecasting moves in US bond markets will establish clear signposts for other markets.
The 50-year chart below shows US 10-year bond yields are at, or below, funding rates at the terminal rate (see each arrow which points to the end of rate hikes).
The Fed suggests this funding rate is 3.00% via their dot plots. With 10-years bonds already reaching 2.94% versus current funding at 1.50%, (but expected funding at 3.00%), much of the cheapening has already occurred.
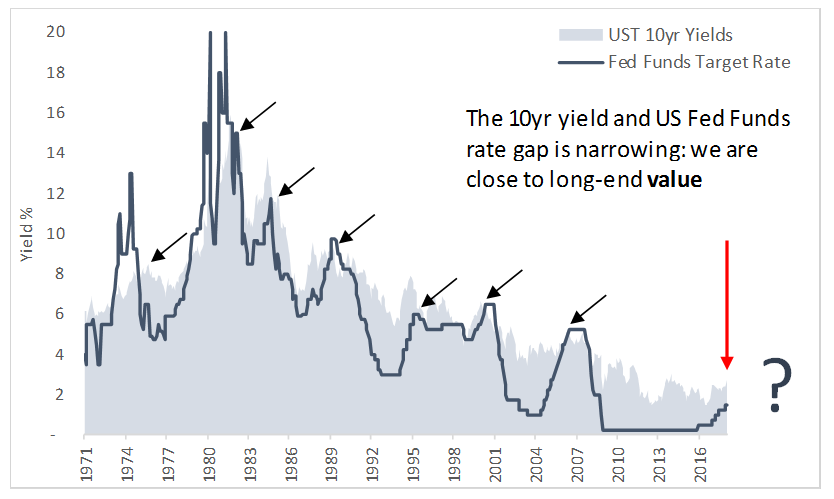
Chart: US 10 year bond yields vs US Fed Funds Target Rate (1971 – 2018)
To get excited about the possibility of sustained higher rates beyond 3.00%, you must find a path to higher terminal rates without causing a US recession, an equity market meltdown, or a collapse in historically expensive credit markets.
Remember, if your mortgage costs $1,000 a week at 4.00%, it costs $1500 a week at 6.00%. Rate hikes really hurt, and the pain is constant. With another six rate hikes still to come, we cannot join the economic dots to a higher terminal rate expectation.
So we feel most of the bond market cheapening is now complete for longer-dated bonds.
Is the recent inflation pulse here to stay?
We believe US inflation is cyclical and will dissipate as the business cycle peaks and then decays via US Federal Reserve rate hikes over 2018/2019.
Whilst wage gains are a key component of inflation, equally important are tradeables inflation (via USD currency) and energy prices.
A 15% peak to trough decline in the USD has driven tradeables inflation (as seen in higher imports prices). Interest rate differentials work over time and with the highest short-dated rates in 10 years, USD bonds should experience flows into USD assets, curtailing the inflationary pulse of a declining USD. A rise in the USD will drive negative velocity into this part of inflation modeling.
Oil’s rally from $25 to $65 has also provided positive inflation velocity (although now negative at sub $60). OPEC stands above the market with additional supply and remains motivated to keep the shale revolution mothballed hence expected velocity is mute to negative.
We believe 2018’s inflation impulse is cyclical and that higher rates on record debt burdens will kill consumer activity, thus corporate profitability, choking full employment and the cyclical wages pressures associated.
Further recent exclusive insights:
Australia: A canary in the coal mine, Chris Watling, Longview Economics
Don’t bet against the US recovery, Ronald Temple, Lazard Asset Management
Australia is overdue a recession, Richard Quin, Bentham AM
Never miss an update
Enjoy this wire? Hit the ‘like’ button to let us know.
Stay up to date with my current content by
following me below and you’ll be notified every time I post a wire
Livewire Exclusive brings you exclusive content from a wide range of leading fund managers and investment professionals.
4 topics
4 contributors mentioned
Livewire Markets
Livewire Exclusive brings you exclusive content from a wide range of leading fund managers and investment professionals.
Expertise
Livewire Markets
Livewire Exclusive brings you exclusive content from a wide range of leading fund managers and investment professionals.
Expertise
Comments
Comments
Sign In or Join Free to comment
most popular
Investment Theme
If 24 LICs ran the Melbourne Cup, which ones would we back?
Affluence Funds Management