The only charts that matter today (part 2)
A good chart distils terabytes of data into a small image that delivers a big message. And to cherry-pick the messages investors need to hear most right now, we asked some of Australia’s top managers to nominate one chart above all others.
Mik Case from Schroders and Chris Rands at Nikko both focus on the dramatic effects of the Fed’s changing balance sheet, while Brett Gillespie flags an equity rally off the back of Fed policy. Scott Haslem at Crestone looks closer to home at how Australian unemployment will determine the RBA’s decision on cut versus hike. Frank Uhlenbruch at Janus Henderson and Shane Oliver both nominate key leading indicators to monitor, Jonathan Rochford points to some terrifying Chinese stats and Tim Slattery from APN (with input from Nicolas Cage) reminds us that correlation doesn’t always mean causation…
Don’t get distracted by the noise
Tim Slattery, APN Property Group
The term ‘Deluge’ understates the amount of information now available to try to help people invest more successfully and this chart is a great reminder of, politely, how useless the overwhelming majority of it is. In my very humble opinion that seems very often true for the consensus views on markets and macroeconomics. I would view the lot of it with a very large (and hopefully healthy) degree of scepticism.
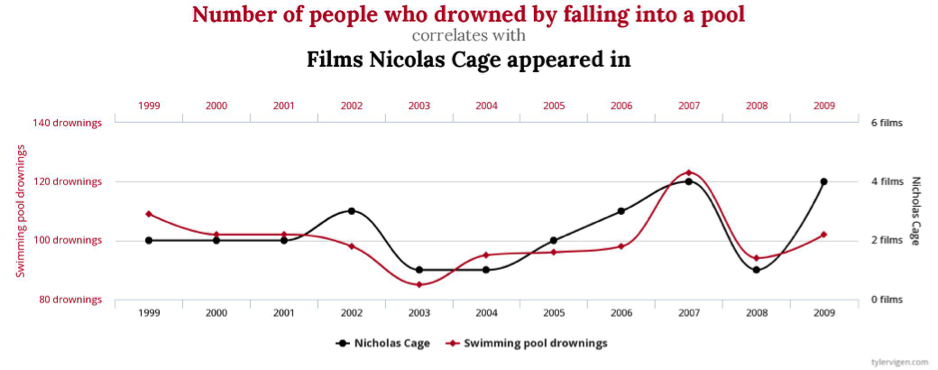
My second chart below tracks RBA various rate expectations over time versus what has actually transpired.
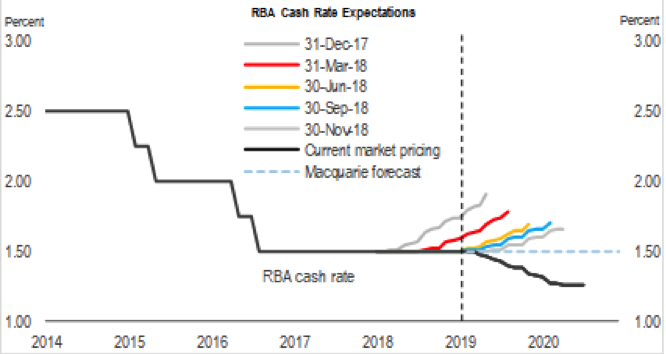
I’ve added this for a couple of reasons. First, it’s a great reminder of how much information out there (including market consensus) will ultimately be proved wrong and therefore highlights the value in the courage of standing against the crowd.
Second, as commercial property investors focused on income it really highlights why we believe the sector should continue to be supported (at least by the market for the next year or ‘forecast period’).
Will looser settings stop PMI’s drifting down?
Shane Oliver, AMP Capital
Global Purchasing Managers Indexes (PMIs) – surveys of purchasing managers at businesses in most major countries – provide an excellent and timely guide to global economic conditions. Last year they slowed and this – along with Trump’s trade war, various other political uncertainties and fears about the Fed – contributed to a plunge in share markets.
So far this year share markets have rebounded but the PMIs have remained soft. Many fret that this divergence is unsustainable and that shares will soon resume their plunge.
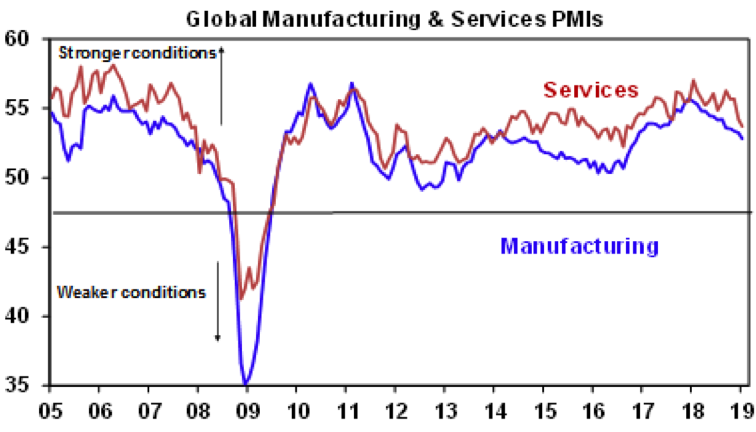
Source: Bloomberg, AMP Capital
Yes, shares are vulnerable to a pullback. But, our view is that more dovish/stimulatory policy settings globally along with a fading of the trade war threat will soon see the PMIs stabilise and head back up again much as occurred after the 2012 and 2015 slowdowns.
At this stage, we are still waiting but the PMIs are worth keeping an eye on, but at least the easier policy settings are falling into place.
Bloomberg’s ‘Trends in financial conditions’ as a compass
Frank Uhlenbruch, Janus Henderson
I look at a large number of charts and relationships to form my views, but one chart that I feel tells an interesting story is trends in financial conditions.
Aside from trade uncertainty, Brexit and the US government shutdown, a key feature in 2018 was the markets apparent comfort with the first three of the US Federal Reserve’s (Fed) rate rises. Indeed, US financial conditions* were actually at their most accommodative after the Fed’s September tightening (3).
Chart 1: Trends in Financial Conditions* (units are standard deviation from the mean)
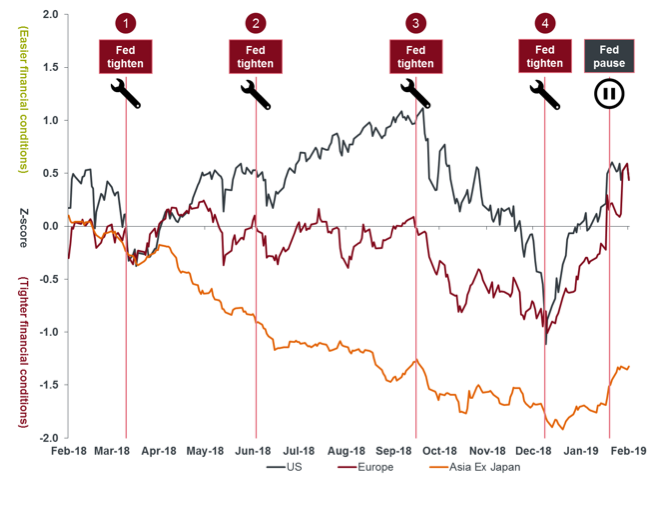
Source: Bloomberg Financial Conditions Indices for the US, Euro-zone and Asia ex-Japan, daily to 12 February 2019
However, it all went south after that as markets became worried that the Fed was on a path of “over-tightening”, increasing the risk of a US hard-landing.
Perhaps it was a case of the September rate hike being ‘the straw that broke the camel’s back’. The year ended on a sour note with risk appetite swooning, output falling, bonds on the bid and equities on the offer.
By January 2019, the Fed responded, leaving rates on hold and signalling it had moved from “tightening” mode to “patient” mode, clearly aware that the tightening financial conditions would make it harder to meet its economic growth forecasts.
The Fed was not the only central bank to shift its policy bias, with the Reserve Bank of Australia moving to a neutral stance after having a tightening bias in 2018.
Where to from here..?
Ongoing positive financial conditions would signal confidence in the durability of the global recovery and support risky assets while also pointing to modest upward pressure on bond yields.
A fall in financial conditions would signal concerns about the economic outlook and suggest that bond yields could fall further as central banks look to provide policy support. A detour down this path would initially see equities and credit under pressure before a rebound once markets are convinced that any fiscal/monetary response is strong enough.
*As measured by Bloomberg Financial Conditions indices which are unique regional composite measures capturing money, bond and equity market trends as well as capital flow proxies in the case of the Asia Ex-Japan index.
Debt defaults quadrupled in China last year
Jonathan Rochford, Narrow Road Capital
In 2018 the level of Chinese bond defaults jumped as the central government started to allow corporates, local government finance vehicles and even state-owned entities to default on their debts.
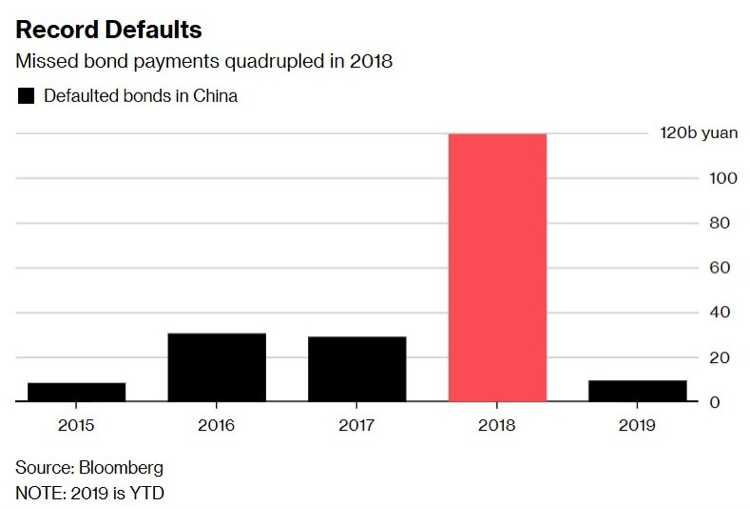
In February there have been two large Chinese corporates miss bond payments, with the government intervening to bail out one of them. This trend has two key implications.
First, China supplies around one-third of global economic growth but has accounted for 60% of global credit growth. As Chinese businesses and consumers are facing greater difficulty in accessing new debt, their ability to invest and consume is falling. This Chinese sneeze could cause the world to catch a cold.
Second, Chinese investors have come to expect that their debt investments are riskless after a long history of government bailouts. Investors are now starting to take losses and are responding by curtailing their investments. This change in sentiment could be the match that lights the bonfire of low quality debt in China.
In January, China’s credit growth smashed the previous record high. This might delay the onset of a credit meltdown, but it will increase the severity of it when it does arrive.
The next 6 months should see a grinding rally in equities
Brett Gillespie, Ellerston Capital
The pivot by the Fed in January has eased our financial conditions index (FCI) dramatically. Indeed, it was the tightening in the FCI that prompted the dramatic about turn by the Fed. We expect financial conditions to improve further given the Fed’s new orthodoxy.
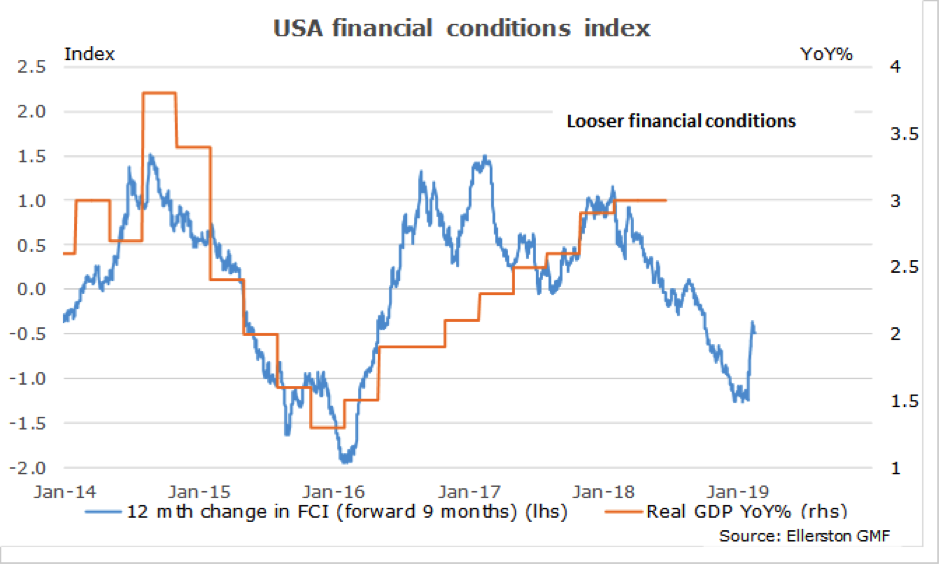
Meaning we expect US growth this year to hold in fine, around 2.4% (with a little help from fiscal stimulus). We needn’t fear a US recession until our FCI tightens enough to foreshadow one. The next 6 months should see a grinding rally in equities as these fears ease (and absent another shock!)
Chinese yields closely correlated to the QE unwind
Chris Rands, Nikko Asset Management Australia
When the US Federal Reserve (Fed) decided to start unwinding their Quantitative Easing (QE) purchases, Chairman of the Fed, Janet Yellen, said that she hoped it would be as “uneventful as watching paint dry”. The markets accepted this narrative and started the game of forecasting higher interest rates.
However, when casting a wider net to look for the effects of QE it shows distortions occurring outside the United States. The chart to watch shows the effect of QE on Chinese yields.
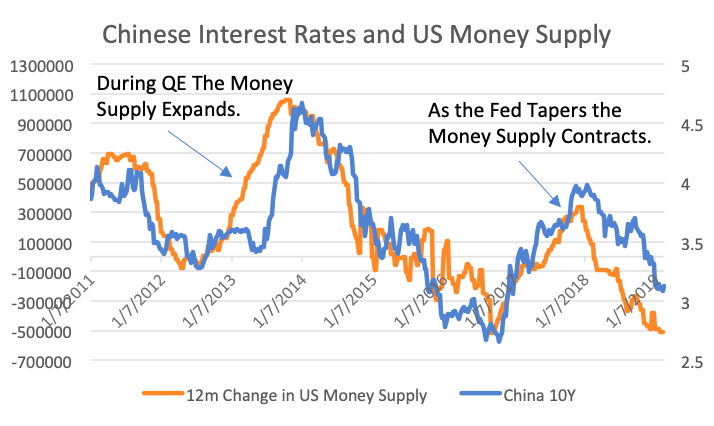
Source: Bloomberg
When the Fed was buying assets (increasing the money supply), Chinese bond yields rose and when the Fed began selling assets (reducing the money supply), Chinese yields fell. This reflects the fact that QE may be causing unintended side-effects, slowing growth rates and forcing monetary policy reactions outside of the US.
My expectation is that the Fed will change their “uneventful” view and stop unwinding their balance sheet this year, leading to Chinese bond yields selling off. Given financial markets often use interest rates as a barometer of health, this will provide a strong signal that the Chinese economy is recovering and benefitting from more accommodative US policy. However, in the event that the Fed continues to unwind its balance sheet, it will weigh on Chinese bond yields and send the signal of a slowing economy.
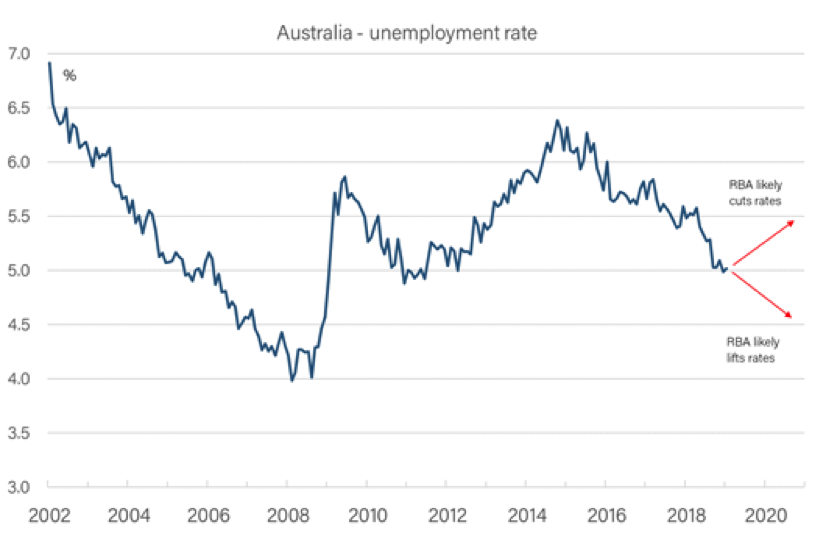
RBA to cut? Watch the Australian unemployment rate
Scott Haslem, Crestone Wealth Management
Will the Australian economy succumb to a recession or just a decent growth slowdown? Will Reserve Bank of Australia (RBA) Governor Lowe escape the need to cut rates to a new record low, or will he just be forced to delay the RBA’s long-held plan to lift rates closer to normal?
Australia, as always, is impacted by offshore trends, and the S&P/ASX 200 index will bow to developments around the US-China trade war, US Federal Reserve policy and China stimulus. But Australia’s fortunes will also depend on the path of the local jobs market.
With full-recourse lending, Australians typically pay their mortgages before they feed their family. Crisis in Australia will arrive when households can’t do either. That’s historically when jobs are lost and unemployment rises. Unemployment has been steady at 5% for almost half a year. This is a key chart to watch this year.
If unemployment recommences its grind lower, the RBA will reject market fears of a recession and will likely edge rates higher in 2020. But if unemployment starts rising, even by as little as a few tenths to 5.5%, history says the RBA will be cutting rates again.
General advice notice: Unless otherwise indicated, any financial product advice in this email is general advice and does not take into account your objectives, financial situation or needs. You should consider the appropriateness of the advice in light of these matters, and read the Product Disclosure Statement for each financial product to which the advice relates, before taking any action. © Crestone Wealth Management Limited ABN 50 005 311 937 AFS Licence No. 231127. This email (including attachments) is for the named person’s use only and may contain information which is confidential, proprietary or subject to legal or other professional privilege. If you have received this email in error, confidentiality and privilege are not waived and you must not use, disclose, distribute, print or copy any of the information in it. Please immediately delete this email (including attachments) and all copies from your system and notify the sender. We may intercept and monitor all email communications through our networks, where legally permitted.
Real potential for liquidity withdrawal to upend markets
Mihkel Kase, Schroders Australia
This is a chart I’ve been watching closely lately, as it highlights that the Quantitative Easing (QE) “experiment” following the GFC looks to be coming to an end. As central banks move from QE to Quantitative Tightening (QT) the question is how this will play out in markets.
In Q4 of 2018 we had a taste of what might be to come. Volatility spiked, equities fell sharply, and bonds rallied. The Fed’s subsequent “patient” tone then soothed market fears and risk assets rebounded.
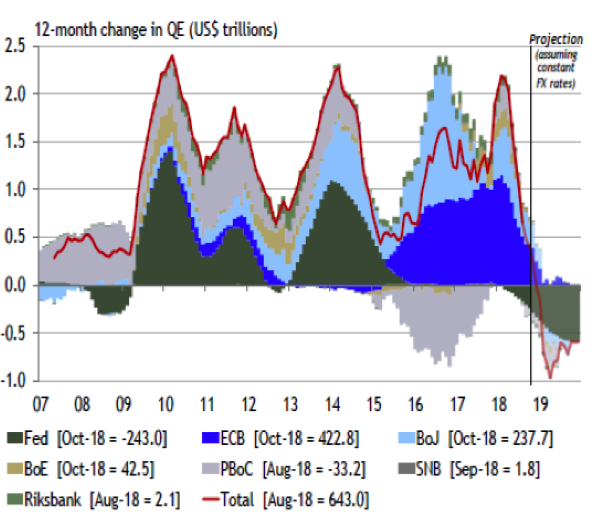
Source: ASR Ltd/Datastream from Refinitiv
What the end of 2018 highlighted was that the potential for global liquidity withdrawal to upend markets is real. With volatility having been largely supressed and liquidity potentially mispriced, market risks remain high. Flexibility to actively manage risk positions and mitigate downside risks will be key in navigating the path ahead.
Important Information
Opinions, estimates and projections in this article constitute the current judgement of the author as of the date of this article. They do not necessarily reflect the opinions of Schroder Investment Management Australia Limited, ABN 22 000 443 274, AFS Licence 226473 ("Schroders") or any member of the Schroders Group and are subject to change without notice. In preparing this document, we have relied upon and assumed, without independent verification, the accuracy and completeness of all information available from public sources or which was otherwise reviewed by us.
Schroders does not give any warranty as to the accuracy, reliability or completeness of information which is contained in this article. Except insofar as liability under any statute cannot be excluded, Schroders and its directors, employees, consultants or any company in the Schroders Group do not accept any liability (whether arising in contract, in tort or negligence or otherwise) for any error or omission in this article or for any resulting loss or damage (whether direct, indirect, consequential or otherwise) suffered by the recipient of this article or any other person.
Investment in Schroder Funds may be made on an application form in the Fund’s Product Disclosure Statement available from Schroders. This document does not contain, and should not be relied on as containing any investment, accounting, legal or tax advice. Past performance is not a reliable indicator of future performance.
The only charts that matter today (part 1)
If you enjoyed that, in our previous wire, Angela Ashton from Evergreen Consultants picks one chart to explain why you should sell anything you don’t have long-term conviction in, Charlie Jamieson from Jamieson Coote Bonds reveals the real reason the Fed suddenly went dovish, Kerry Craig from J.P. Morgan Asset Management quotes Jimi Hendrix to question the tenacity of this rebound, Ash O’Connor from Invesco makes the case for looking at Alternatives, and Callum Thomas of Top Down Charts nominates the chart you need to watch for a heads up on when it’s going belly up.
Read on to see the 5 charts that these investment experts never take off their screens, and to hear why they are so critical.
Never miss an update
Enjoy this wire? Hit the ‘like’ button to let us know.
Stay up to date with my current content by
following me below and you’ll be notified every time I post a wire
Livewire Exclusive brings you exclusive content from a wide range of leading fund managers and investment professionals.
3 topics
7 contributors mentioned
Livewire Markets
Livewire Exclusive brings you exclusive content from a wide range of leading fund managers and investment professionals.
Expertise
Livewire Markets
Livewire Exclusive brings you exclusive content from a wide range of leading fund managers and investment professionals.
Expertise
Comments
Comments
Sign In or Join Free to comment